
NSX-T 3.0: Operation Guide
1. Overview
Operations and visibility are key metrics that enterprise assess the risk and success of their businesscritical applications. NSX-T is a software defined network platform when deployed touches every aspect of enterprise connectivity and thus understanding, leverage and building successful operational design and best practices can define a difference between a successful and a failed environment.
NSX-T provides several tools and utilities to simplify daily operations and provide the level of visibility an enterprise-grade SDN solution requires. They can be classified into three main categories:
- Visibility -Tools provides information about the health and status of the NSX components, traffic statistics or visibility of the different systems connected to NSX
- Operations - Tools and utilities focused on simplifying installation and other common tasks like upgrading the system, backup/restore or getting the corresponding support bundles
- Troubleshooting - Tools help finding out problems or configuration issues when something does not work
NSX-T also works with other VMware and 3rd party operational tools. For example, vRealize Network Insight(vRNI) which is a comprehensive operational tool for the entire SDDC environment. This guide outlines how to utilize vRNI to monitor and troubleshoot NSX deployment. This guide also outlines vRealize Log Insight(vRLI) Content Pack which was developed for NSX-
T.
The following sections describe the NSX installation process, tools, remote authentication, and Rolebased access control (RBAC) including two-factor authentication.
2. VMware NSX Architecture
VMware NSX-Tis designed to address application frameworks and architectures that have heterogeneous endpoints and technology stacks. In addition to vSphere, these environments may include other hypervisors, containers, bare metal operating systems, and public clouds. NSX-T allows IT and development teams to choose the technologies best suited for their applications. NSX-T is also designed for management, operations, and consumption by development organizations in addition to
IT.
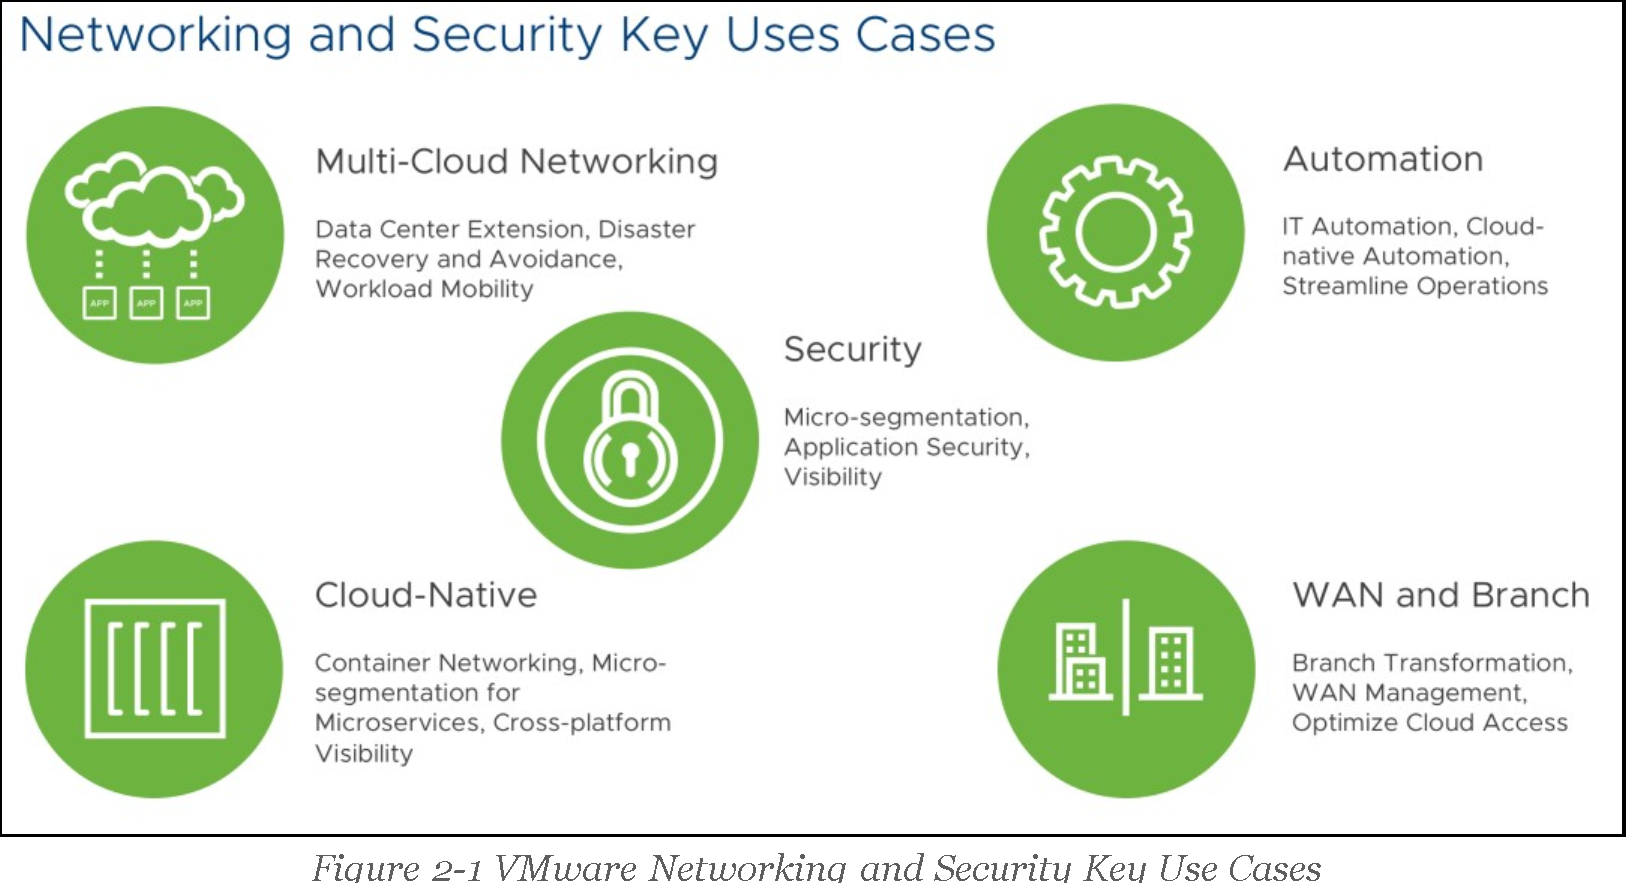
VMware NSX consists of several products work seamlessly to cover numerous use cases and provides complete, state-of-the-art, easy to use, end-to-end networking and security solution regardless of where the workloads are hosted.
• VMware NSX Data Center – virtualization and security platform extend software defined networking across data centers, clouds, and endpoints.
• VMware NSX SD-WAN by VeloCloud – assures enterprise and cloud application performance over Internet and hybrid WAN while simplifying deployments and reducing costs.
• VMware NSX Cloud – delivers consistent and operationally scalable micro-segmentation security for applications running natively in public clouds.
This guide focuses on VMware NSX-T Data Center, and sets the foundation to operate, manage and troubleshoot the core VMware NSX product.
2.1 VMware NSX-T Data Center Overview
VMware NSX-T Data Center is the core component of the VMware NSX-T solution. It delivers consistent networking and security across multiple hypervisors and workloads (VMs, containers and bare metal servers).
It aims at building agile, secure and flexible private clouds, which can be interconnected and extended to public clouds (either built on VMware technologies or native public clouds) the moment business demand requires it.
VMware NSX-T consists of three separate but integrated planes—management, control, and data. These planes are implemented as sets of processes, modules, and agents residing on three nodes— manager, controller, and transport nodes.

Figure 2-2 VMware NSX Data Center Architecture for Private Cloud
Please see detail explanation in the Reference Design Guide https://communities.vmware.com/docs/DOC-37591
• NSX Virtual Switch: The NSX-T virtual switch comes in two forms - NSX Virtual
Distributed Switch (N-VDS) and VDS with NSX. On ESXi hosts both the N-VDS and VDS with NSX i (NSX-T 3.0 onward) is supported. With any other kind of transport node (KVM hypervisors, Edges, bare metal servers, cloud VMs etc.) the N-VDS is the only switch supported. VDS with NSX has few specific operational considerations. Please refer to https://kb.vmware.com/s/article/79872 for further details.
• Hypervisor Transport Nodes: Hypervisor transport nodes are hypervisors prepared and configured for NSX-T. The N-VDS provides network services to the virtual machines running on those hypervisors. NSX-T currently supports VMware ESXiTM and KVM hypervisors. The NVDS implementation of KVM is based on the Open vSwitch (OVS) and platform independent. It can be ported to other hypervisors and serves as the foundation for the implementation of NSX-T in other environments (e.g., cloud, containers, etc.).
• Edge Nodes: VMware NSX® Edge nodes are physical or virtual appliances dedicated to running network services that cannot be distributed to the hypervisor nodes. These include dynamic routing protocols, NAT (Network Address Translation), Load Balancing or VPNs (Virtual Private Cloud), to name a few. VMware NSX Edges are grouped in one or several clusters, representing a pool of capacity.
For further details about VMware NSX-T Data Center architecture and features, please review the VMware NSX-T Reference Design Guide and the latest NSX-T Documentation available at https://communities.vmware.com/docs/DOC-37591
3. Visibility Tools
NSX provides comprehensive monitoring tools through NSX native monitoring capability and integration with 3rd party tools.

This section describes the following tools:
3.1 Dashboards
3.2 Counters/Stats/Tables
3.3 Monitor Logical Switch Port Activity
3.4 BGP Neighbor Status, Geneve Tunnel Status
3.5 VM Inventory
3.6 Search Utility
3.7 APIs, CLI, Central CLI
3.1 Dashboards and Overview
NSX-T includes an out-of-the-box dashboard that allows administrators to check the status of the primary NSX components in a single pane of glass.
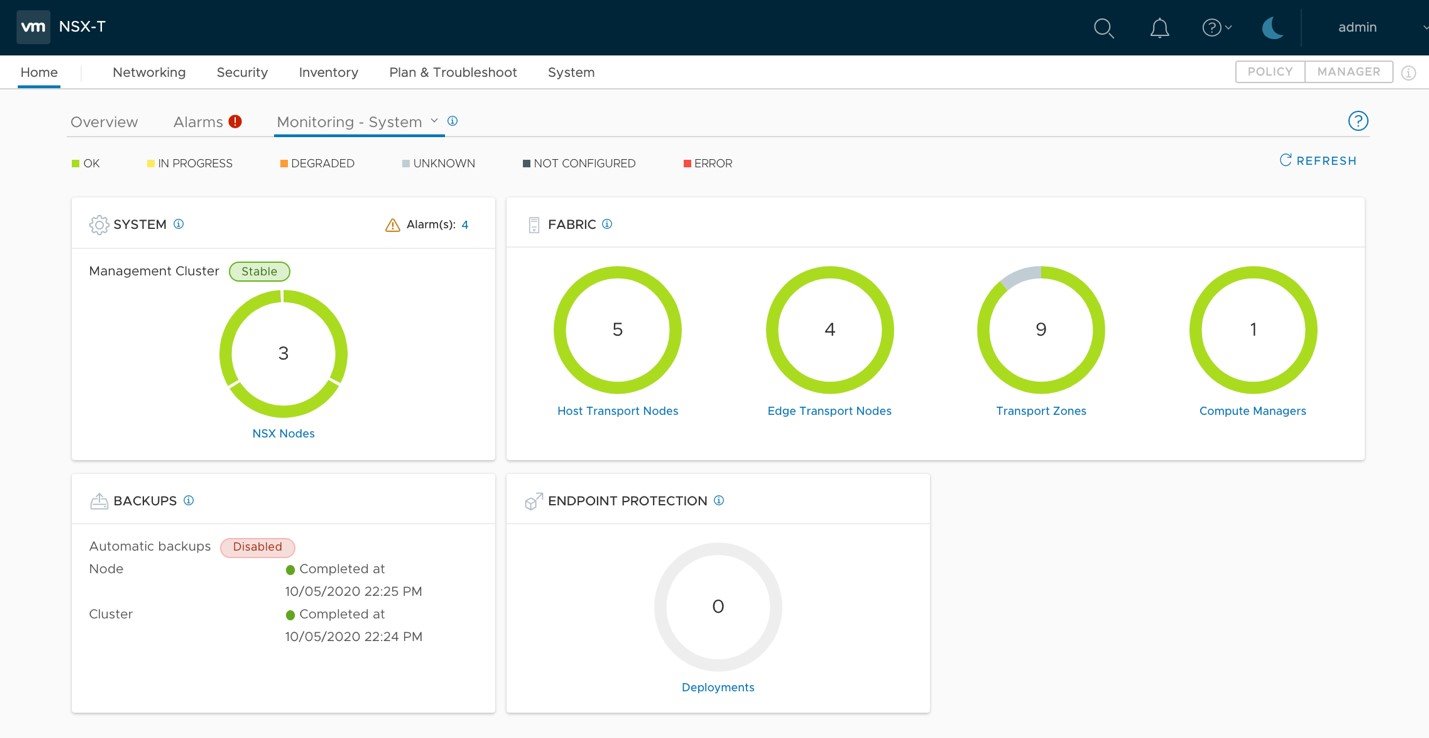
Figure 3-1-1: Dashboard from NSX-T 3.0
Details of NSX-T dashboards in NSX-T 3.0 release is listed below.
• System dashboard comprises the following four widgets:
o Hosts – multi-widget with two parts showing the following information:
▪ Deployment – status of the installation of NSX software on the different hosts
▪ Connectivity – status of the communication between the hosts and the NSX
Manager
o Edges – multi-widget with two parts showing the following information:
▪ Deployment – status of the installation of NSX software on the different edges
▪ Connectivity – status of the communication between the edges and the NSX
Manager
- Transport Nodes – donut widget showing information about the status of the different transport nodes
- Transport Zones – donut widget showing information about the status of the different transport zones
• Clusters dashboard shows the health status of the management cluster as shown below.

Figure 3-1-2: Manager Dashboard from NSX-T 3.0
• Networking dashboard consists of the following widgets o Tier-0 Gateways o Tier-1 Gateways o Segments
- VPN
- Load Balancing

Figure 3-1-3: Networking Dashboard from NSX-T 3.0
• Security dashboard composed of the following widgets o Distributed FW o Network Introspection o Endpoint Protection

Figure 3-1-4: Security Dashboard from NSX-T 3.0
Users can hover over the different widgets to get additional details about their system:

Figure 3-1-5: Hovering over the widgets
By clicking a component, users can automatically navigate to the configuration page of the corresponding component to get detail status of the component. For example, after clicking the Transport Nodes widget, users can see the page shown below.

Figure 3-1-6: Transport Nodes configuration page
For the Backups widget, clicking on the CONFIGURE footer takes users to the backup’s configuration page.
3.1.1 Dashboards Color Code
The dashboards page includes a legend with the possible different status of the components.
![]()
Figure 3-1-7: Possible status
When system detects issues, these colors are used to report them.

Figure 3-1-8: Dashboard reporting issues
The green status (Ok) is used when everything works fine, and the red one (Error) when there are major issues impacting NSX functionality.
The blue status, Pending and In Progress, are used to report the installation of NSX software on hosts and edges.
Status Degraded and Unknown (yellow and grey) are used to report the status of Transport Nodes and Transport Zones, which are computed as described in the following paragraphs.
Transport Node Status
It is based on four different status:
• Manager Connectivity Status
• Controller Connectivity Status
• pNIC/Bond Status
• Overlay Tunnel Status
Based on them, the overall Transport Node Status is computed as follows:
• UP – if all four previous status are UP
• Degraded – if at least one of status is Degraded or Controller Connectivity Status is down
• Down – if either pNIC/Bond Status or Tunnel Status is down
• Unknown – if Manager Connectivity Status is down
![]()
Note: Hypervisors report Tunnel Status as Down when they don’t have workloads connected to NSX Logical Networks, which means they don’t have any Geneve tunnel established with other Transport Nodes.
![]()
Transport Zone Status
When all Transport Nodes in a Transport Zone share the same status, the Transport Zone status is easily computed:
• If all Transport Nodes are UP, the Transport Zone status is UP
• If all Transport Nodes are Down, the Transport Zone status is Down
• If all Transport Nodes are Degraded, the Transport Zone status is Degraded
• If all Transport Nodes are Unknown, the Transport Zone status is Unknown
When there are Transport Nodes with different status, the Transport Zone status is computed as follows:
• If some (but not all) Transport Nodes are Down or Degraded, then the Transport Zone is Degraded
• If there are no Transport Nodes in a Transport Zone, then the Transport Zone status is Unknown
• If none of the Transport Nodes are Down or Degraded, but some of the Transport Nodes are in Unknown state, then the Transport Zone status is Unknown
The following figure depicts the Transport Zone widget reporting one Degraded and one Unknown Transport Zone with corresponding detailed status.
• tz-overlay01 has some but not all Transport Nodes Down, and thus its status is Degraded
• tz-vlan01 has no Transport Nodes Down or Degraded, but some of them are in Unknown state, thus its overall status is Unknown

Figure 3-1-10: Transport Zone Status
Nevertheless, whenever the dashboard reports any color other than green, it is a good practice to click on the affected widget to get further details in order to determine the root cause of the issue.
3.1.2 Custom Dashboards
Besides the out-of-the-box dashboards described on the previous section, it is possible to define custom dashboards in NSX-T. Custom dashboards allow to easily monitor specific use cases, which may be relevant for deployments, but may not be included out-of-the box.

Custom dashboards were introduced in NSX-T 2.1. The following five widgets are supported in the initial release.
- Label Value Widget – Data is displayed as text with the possibility of adding status icons and tooltips. No additional graphical representation is allowed.

Figure 3-1-12: Label Value Widget
- Donut Widget – Data is displayed in a circle, which can have different colors depending on the corresponding status.

Figure 3-1-13: Donut Widget
- Sectioned Donut – Several data sources are represented as different sections of the same donut widget.

Figure 3-1-13: Sectioned Widget
- Multi-widget – A donut splits into halves, representing different (but typically related) information on each of them.

Figure 3-1-14: Multi Widget
- Widget Container – A container groups related donut widgets together.

Figure 3-1-15: Widget Container
Custom dashboards are configured, updated and deleted through NSX-T Manager APIs. Please refer to the Dashboard section of NSX-T API documentation for further details.
3.2 Counters, Statistics and Tables
Counters, statistics, and tables provide visibility on different aspects of the traffic that goes through NSX. The table below summarizes the major statistics and tables exposed through the NSX Manager:
|
Component |
Statistics Gathered |
|
NSX Manager Node |
CPU, Memory, Disk, Interface Stats (Packet Count / Bytes) |
|
Transport Node (ESXi, KVM, Edge) |
System status (CPU/Memory/File System/Uptime/Load Avg) Physical and VM interface status (Rx/Tx bytes) Communication Channel Health |
|
Logical Switch (Segment) |
Interface Stats (Bytes, Packet Count, Rx/Tx) TEP table, MAC table, Switch Security (Blocked Packets) |
|
Logical Router (T0/T1 Gateway) |
Interface Stats (Bytes, Packet Count, Rx/Tx) Forwarding Table, ARP tables, Routing table NAT stats |
|
Distributed Firewall |
Per-rule flow stats (Number of sessions allowed/blocked, bytes, packets) |
|
L2 Bridge |
Port stats, Status, Cluster status |
Figure 3-1-17: NSX-T Summary of Statistics and Tables
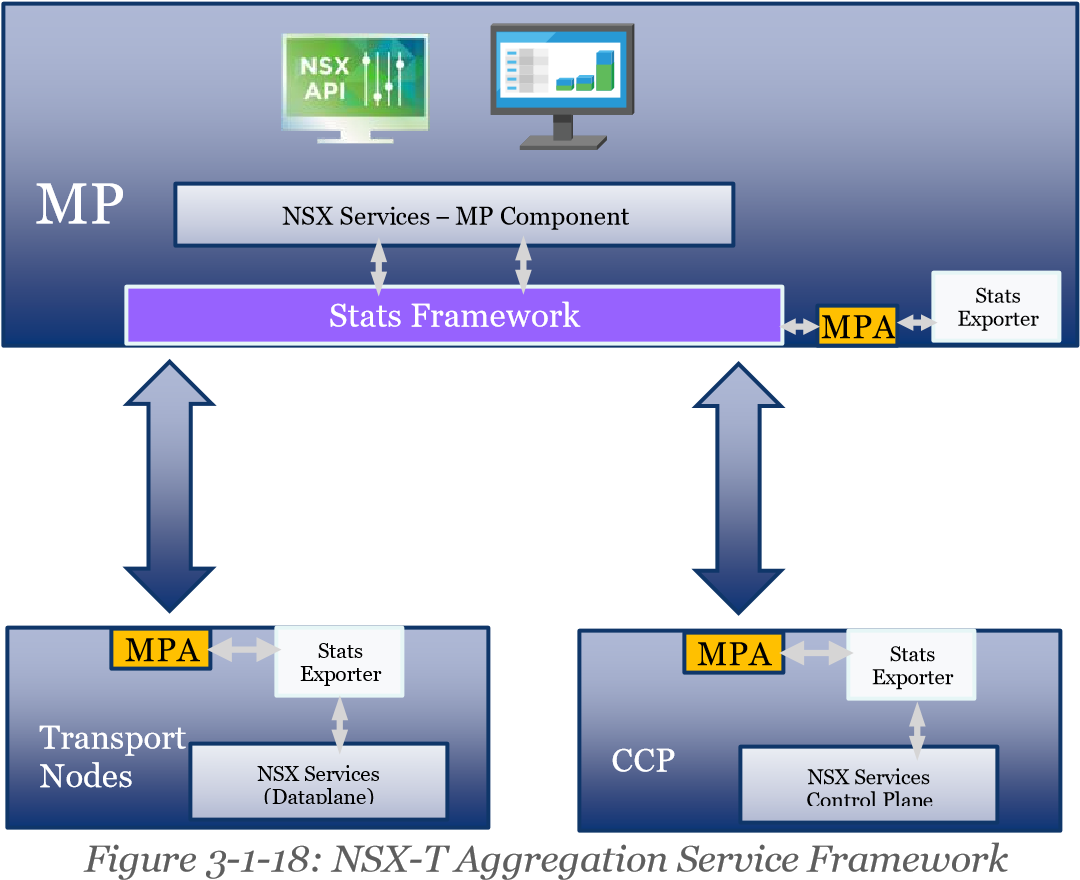
There is an aggregation service framework that runs within the NSX Manager and exposes public facing REST APIs.
• Node statistics (like CPU, Memory, Disk, or Interface-related information) are exposed by the NSX Manager Nodes and Transport Nodes (i.e., ESXi, KVM and NSX Edge Nodes).
• Additionally, each function running on the Transport Nodes (Logical Switching, Logical Routing, NAT and DFW) exposes operational data relevant to that function.
• On-demand statistics such as Interface statistics, MAC address tables or TEP tables, are queried at real-time while bulk statistics (typically aggregation of distributed stats) are collected by polling periodically.
This framework is consumed internally by the graphical user interface, Port-connect Tool and Traceflow, which are two features covered later this guide.
NSX-T counters, statistics and tables can be found by navigating to the corresponding NSX-T UI pages, as explained on the following sections.
3.2.1 Transport Node Counters/Stats/Tables
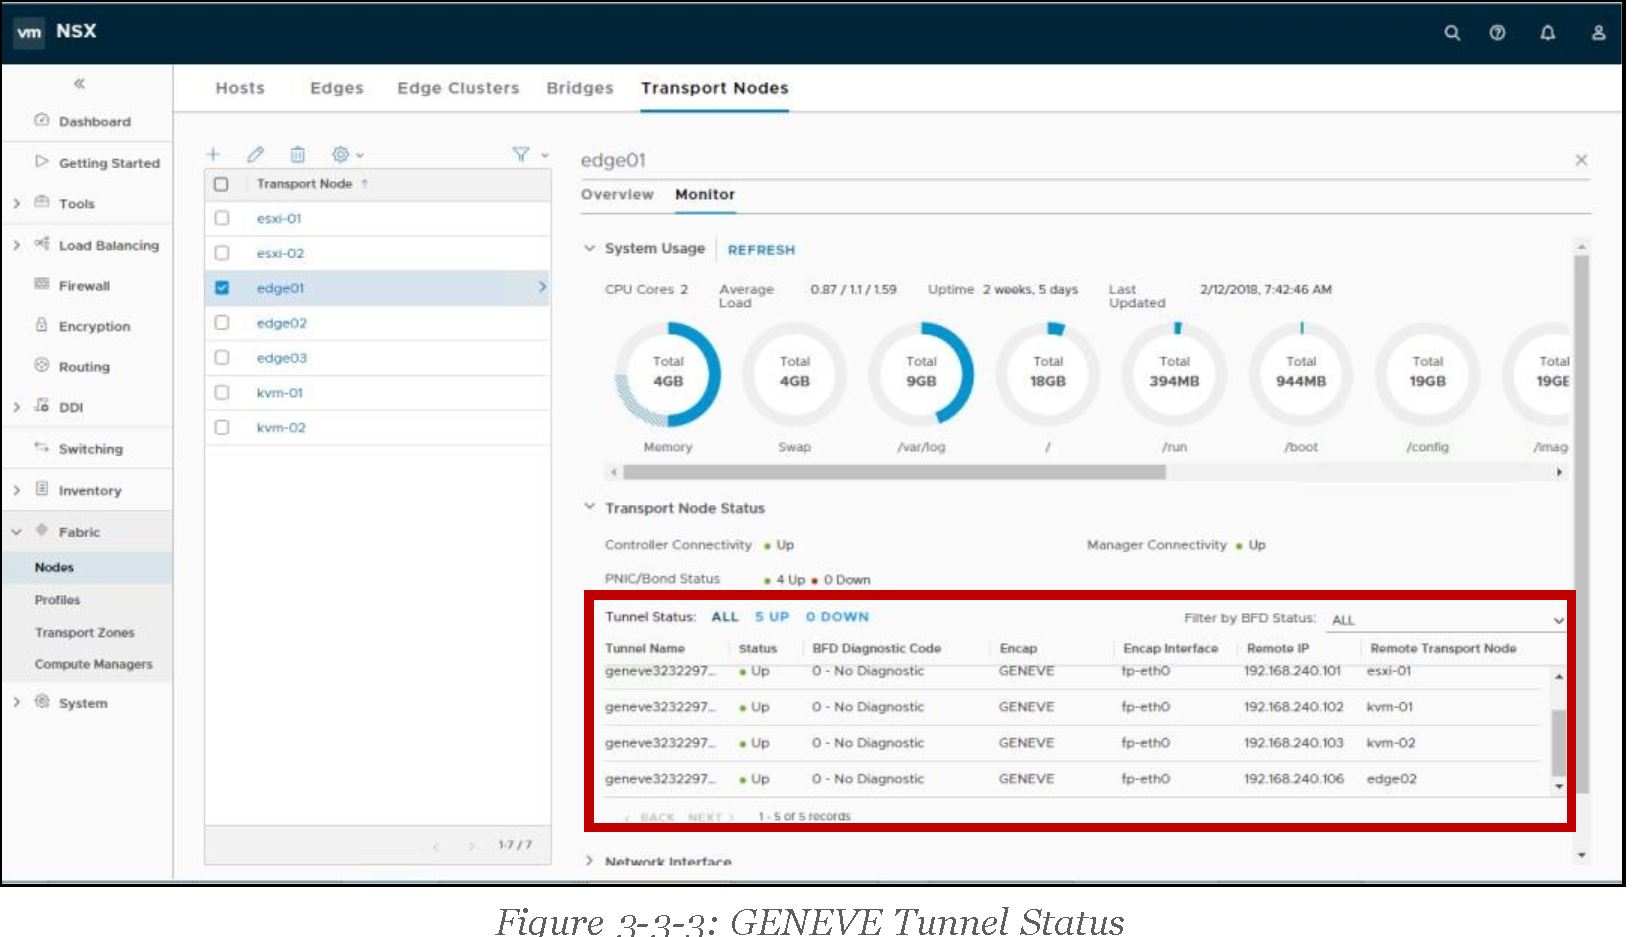
Transport Node information is available under Fabric > Nodes > Transport Nodes. By clicking on a specific node, and moving to its Monitor tab, the following information is exposed:
• System Usage – including CPU, memory, file system information, load and uptime
• Transport Node Status – including status of the connectivity to Manager and Controllers, pNIC/Bond status.
• Tunnel Status – status and remote transport node of the overlay tunnels established by the host.
Note: Both Transport Node status and Tunnel status reported every 3 minutes on ESXi/KVM/BM and every 30 seconds on Edge node. The status on the UI needs to be refreshed manually.
• Network Interface – list of network interfaces on the node, including admin and link status,
MTU, interface details (MAC address, IP address, network mask) and traffic statistics (Total Bytes, Total Packets, Dropped Packets, Error Count)

3.2.2 Layer 2 Counters/Stats/Tables
Layer 2 information can be found on different tabs. Those related to logical ports provide individual information for a specific port while those related to logical switches provide aggregated information for that logical switch.
For Logical Switches
On the NSX Manager UI, switch to Manager UI from Policy UI first, then navigate to the Switching menu, ensure the Switches tab is selected, click on the switch you want to see information for, and finally click on its Monitor tab. Details are then displayed, including:
• Cumulative Traffic statistics for Unicast, Broadcast and Multicast, and Dropped packets
• Additional switch-aggregated statistics for blocked traffic, including the reason for traffic being dropped (Spoof Guard, BPDU filter, DHCP Server Block or DHCP Client Block)

From the same page, it is also possible to download TEP and MAC-TEP tables for the switch:

For both tables, users get the option to download information from the Controller Cluster or from the specific Transport Node they may be interested in.

Figure 3-1-22: Logical Switch table details
For Logical Ports
On the NSX Manager UI, navigate to the Switching menu, ensure the Ports tab is selected, click on the switch you want to see information for, and finally click on its Monitor tab. Details are then displayed, including:
• Port-specific Traffic statistics for Unicast, Broadcast and Multicast, and Dropped packets
• Additional port-specific statistics for blocked traffic, including the reason for traffic being dropped (Spoof Guard, BPDU filter, DHCP Server Block or DHCP Client Block)

From the same page, it is also possible to download the MAC table for ports on ESXi hypervisors:

Which is downloaded as a .csv file:

Figure 3-1-25: Logical Port table details
3.2.3 Layer 3 Counters/Stats/Tables
This section describes the different statistics available for routed ports.
Router Port Statistics
To check statistics of the traffic that goes through each router port (Layer 3 router interfaces), navigate to the Routing menu, click on the name of the router you are interested in, select the Configuration tab and then Router Ports on its drop-down menu.
On the Logical Router Ports pane, there is a Statics column. Clicking on the icon provides access to the statistics through each specific port (Layer 3 interface). If the port is part of the distributed component (DR) of an NSX Logical Router, it is then possible to get per-node statistics or aggregated statistics, as it can be seen on the picture:

If the port is part of the services component (SR) of an NSX Logical Router, traffic statistics are related to the Edge node where such port is defined:

ARP Tables
NSX-T also exposes the ARP tables of the router ports, which can be downloaded from the NSX UI as .csv files. Like the Layer 3 statistics, ARP tables are available on the Logical Router Ports pane. To access them, select the router port you are interested in and on the Actions menu, select Download ARP Table:

If the port is part of the distributed component (DR), it is possible to download the table for a specific node, while if it is part of the service component (SR), it is possible to download the ARP table from the Edge node where such port is defined:

Figure 3-1-28: Downloading ARP tables from DR vs SR ports
Forwarding Tables
Finally, NSX-T allows to download from its UI the routing and forwarding tables of the different routers (in .csv files). They are available on the Routing menu, under the Routers tab. Then, to download the table, select the router you are interested in, and from the Actions drop-down menu, select the type of table you want to download:

![]()
Note: Routing table is only available for Tier0 Routers
![]()
It is possible to download the forwarding table from any node in the transport zone, while the routing table is only available for the Edge Nodes:

Figure 3-1-30: Downloading Forwarding vs Routing Table
Also, it is possible to specify filters when downloading the routing table, to narrow down the amount of information retrieved:

Figure 3-1-31: Downloading Specific Routing Information
As noted, before, as to Tier0 routers both routing and forwarding tables are available. The routing table includes routes from the Service Router component only, while the forwarding table includes routes from the Distributed component:

Figure 3-1-32: Sample Routing Table of a Tier0 Router

For Tier1 routers, only the forwarding table is available. The information may vary depending on which node it is downloaded from (i.e., hypervisor or Edge node) and if the Tier1 router has Services Router component or not:

Figure 3-1-34: Sample Tier1 Router Forwarding Table from Hypervisor Node

Figure 3-1-35: Sample Tier1 Router (with SR Component) Forwarding Table from Edge Node
3.2.4 Security Counters/Stats/Tables
NSX-T also provides statistics and counters for the Distributed Firewall (DFW), the Gateway Firewall, and for the NAT service.
NSX Distributed Firewall Counters
The NSX Distributed Firewall exposes per-rule statistics, that show the number of packets, bytes and sessions that have matched each of the rules. Per Rule Level Stats aggregated every 15 Minutes from all the Transport Nodes. Each rule will have the hit count, packet count, session count, byte count and popularity index. Rule statistics can be reset using “Reset All Rules Stats”.

Figure 3-1-36: NSX Distributed Firewall statistics
Gateway Firewall Counters
Similarly, Gateway Firewall provides per-rule statistics.

Figure 3-1-37: Gateway Firewall statistics
![]()
Note: Gateway firewall is only available on the routers that have deployed the Service Router (SR) component.
![]()
NAT Counters
Finally, NSX provides counters for the NAT rules configured. To access these counters, once on the Routing menu, select the Services tab and then, on the drop-down menu, select NAT.
![]()
Note: NAT is provided as a centralized service, and as such, an SR component must be instantiated on the Edge cluster.
![]()
Once on the NAT page, click on the bars icon to get per-rule statistics:

3.3 Monitor Logical Switch Port activity
Counters and stats described in previous sections, show cumulative data gathered over time. Sometimes, it is also required to monitor the activity of a specific logical port over a specific period especially for troubleshooting purposes. NSX provides a port activity tracking tool that allows for that. It is available through the Switching menu, under the Port tab. After highlighting the specific port, the Monitor tab must be selected, and then the Begin Tracking.

After clicking on Begin Tracking, a new window pops-up. It shows the different counters for the selected port, and automatically refreshes every 10 seconds. Once the window is closed, port tracking finishes and the information is eliminated:

Figure 3-2-2: A logical port tracking in progress
3.4 BGP Neighbor Status, Geneve Tunnel Status
Besides counters, statistics and tables for the traffic through the NSX fabric, it is also possible to monitor the status of two other important aspects of a typical NSX deployment: BGP Neighbor Status and Geneve Tunnel Status.
3.4.1 BGP Neighbor Status
BGP (Border Gateway Protocol) is one of the most popular options for establishing routing adjacencies between NSX and existing networks. It can be configured on the Tier-0 Logical Router and, once configured, it is possible to download the routing tables as specified on 3.2.3 Layer 3 Counters/Stats/Tables and it is also possible to check the status of the BGP neighbors from the NSX UI.
To access BGP Neighbor Status information, administrators need to navigate to the Routing menu, then highlight the corresponding Tier-0 router, and finally, on the Actions drop-down menu, select Generate BGP Summary:

By default, the summary shows information from all Edge nodes where the Tier-0 is deployed, but it can be filtered to a specific Edge node if required:

3.4.2 Geneve Tunnel Status
NSX uses GENEVE (GEneric NEtwork Virtualization Encapsulation) as its overlay mechanism. For any given Transport Node (a node participating on the forwarding of NSX Logical Networks), is it possible to check the status of the Geneve tunnels it stablishes with other NSX transport nodes. Geneve tunnel status information is available under the Fabric menu, Transport Nodes tab. Then it is required to highlight the transport node to be checked, and finally, Geneve tunnel information is under the transport node Monitor tab.
For faster tunnel failure detection, NSX uses BFD control packets, which are encapsulated in Geneve and exchanged between the different transport nodes. The Transport Node Monitor page allows to filter the list of tunnels based on their BFD status:

3.5 Monitor Edge Node
Edge resource utilization related information can be found on the Edge Monitor page. You can see number of CPU cores are allocated for an edge node and distribution of the cores between Datapath and Services.

3.6 VM Inventory
NSX-T is decoupled from vCenter, but it reads VM information directly from the different hypervisors it supports (vSphere, RHEL KVM, Ubuntu KVM). This information is leveraged by several features, like the NSX Groups used in firewall policies, or the logical port VIF attachment points.
NSX offers an inventory of the discovered VMs under the Inventory menu and Virtual Machines section. It includes all VMs which exist on the hosts, either they are connected to NSX logical networks or not.

By clicking on the VM name provides additional details for a given VM, including attachment information that allows to determine if it is connected to NSX or not.

Figure 3-5-2: VMs attached and not attached to NSX Logical Networks
3.7 Search Utility
NSX includes a utility that allows to search for objects using different criteria from the NSX inventory. To access the tool, users must click on the magnifying glass available on the top-right corner of the NSX UI.

Figure 3-6-1: Launching NSX Search Utility
Then, they can enter the pattern they are looking for, and they will get a list of the objects (possibly of different kinds) sorted by relevance.

Figure 3-6-2: NSX Search

Figure 3-6-3: NSX Search Result
3.8 APIs, CLI, Central CLI
The visibility options described so far are based on the NSX Manager UI. This section focuses on API and CLI access.
3.8.1 NSX APIs
NSX Manager provides a programmatic API to automate management activities. The API follows a resource-oriented Representational State Transfer (REST) architecture, using JSON object encoding. Clients interact with the API using RESTful web service calls over the HTTPS protocol. API documentation is available under VMware’s official, public NSX documentation at https://docs.vmware.com/en/VMware-NSX-T/index.html , and it is embedded in the NSX Manager itself which can be accessed even in offline NSX deployments.
For that, it is only required to click on the Help icon on the top-right corner of the NSX Manager UI and then select API Documentation on the drop-down menu. Here is an example.

Figure 3-7-1: Accessing NSX Manager embedded API documentation
This will launch a new window, where the NSX API documentation is available. This information is automatically generated from the NSX code:

Figure 3-7-2: NSX Manager embedded API documentation
NSX APIs follow the specifications of the OpenAPI initiative (https://www.openapis.org/), which enables developers and third-party ecosystem to build applications and services around NSX, by standardizing on how REST APIs are described.
It is possible to download the OpenAPI specifications directly from the NSX Manager, by issuing one of the calls below described on the NSX API documentation:
• GET https://<nsx-mgr>/api/v1/spec/openapi/nsx_api.yaml
• GET https://<nsx-mgr>/api/v1/spec/openapi/nsx_api.json

Figure 3-7-3: Downloading NSX OpenAPI Specification
This specification can be later imported into tools like Postman (https://www.getpostman.com/), to get the complete list of NSX APIs ready to consume.
Additionally, there are Python and Java SDKs (Software Development Kits) available for NSX, which can be downloaded from the Drivers & Tools section under the NSX Downloads page at https://my.vmware.com.

Alternatively, NSX SDKs can also be downloaded from https://code.vmware.com/sdks

Figure 3-7-5: NSX SDKs on code.vmware.com
3.8.2 NSX CLI
There is an NSX-specific CLI available on NSX appliances (i.e. Managers and Controllers) and on the hypervisor Transport Nodes.
The way to invoke the NSX CLI varies depending on the type of node. Here are the details.
- NSX Appliances (Managers, Controllers, Edges) - Administrators should SSH into the appliance, and log-in with the admin credentials. They will automatically get into the NSX CLI mode.
![]()
Note: There is also a root user ID to log-in into the NSX appliances, but as stated by the log-in banner, it should only be used when asked by VMware support team.
![]()
- Hypervisor Transport Nodes – Once on the hypervisor CLI, administrators should issue the command nsxcli to enter the NSX CLI. Be aware it may require root privileges.
For example, for a ESXi transport node:
[root@esxcomp-01a:~] nsxcli esxcomp-01a.corp.local> esxcomp-01a.corp.local> esxcomp-01a.corp.local> get log logical-router Logical router logical-routers Logical routers logical-switch Logical switch logical-switch-port Logical switch port logical-switches Logical switches esxcomp-01a.corp.local> get log
And for an Ubuntu-based KVM transport node:
|
vmware@kvm-01:~$ nsxcli -bash: /bin/nsxcli: Permission denied vmware@kvm-01:~$ vmware@kvm-01:~$ sudo nsxcli [sudo] password for vmware: kvm-01> kvm-01> kvm-01> get log logical-router Logical router logical-routers Logical routers logical-switch Logical switch logical-switches Logical switches kvm-01> get log |
The list of available commands may vary depending on the type of node been managed. There is a public, detailed NSX CLI documentation available at https://docs.vmware.com/en/VMware-NSXT/index.html .

Figure 3-7-6: NSX CLI Documentation
![]()
Note: As stated on the NSX Command Line Interface Reference guide, command syntax and output format of NSX-T commands are not guaranteed to be the same from release to release. Thus, for automation tasks it is recommended to use the API.
![]()
3.8.3 NSX Central CLI
To avoid changing interfaces and for those cases where NSX admins/operators may not have access to hypervisors CLI, NSX introduces a feature called Central CLI, which allows to run a command on any NSX appliance or transport node, directly from the NSX Manager CLI.
Furthermore, Central CLI permits to run the same command on multiple nodes at the same time, including nodes of multiple types (for example, run the same command on a Controller, an ESXi hypervisor and a KVM hypervisor).
To use Central CLI, admins must access the CLI of the NSX Manager, and once there, issue the on command:

After entering the on keyword, admins can click on Tab or the question mark to get a list of the nodes where they can run the desired command:

To select a node, admins should enter their UUID. It is enough to enter the first characters and click on the Tab key to get the rest of the string autocompleted. Once one node is selected, it is removed from the list of available nodes.
On the example, the admin has already selected edgenode-01a (UUID 53206bfa-5b8c-11e7-b489005056ae5144), and thus it is not offered as a possible selection again.

To select additional nodes, admins must simply append their UUIDs to the existing list. Once the desired list of nodes is completed, admins should append the exec keyword. Central CLI will then show the list of available commands to run on the selected nodes:

The output of Central CLI identifies which information belongs to each of the nodes where the command is run. The example below, shows the output of the command get logical-routers executed on a KVM hypervisor, a NSX Controller and NSX Edge at the same time:

Sometimes, admins need to run multiple commands on a specific node. To simplify that process and the syntax of the commands to be used, Central CLI allows set a session to a specific remote node. Once on session mode, admins can enter the command in simple NSX CLI syntax, without having to prefix it with on <UUID> exec:

4 Operations Utilities
This section outlines NSX operational utilities listed below: o NSX Upgrade
o NSX Manager Backup/Restore o Support Bundle
4.1 NSX Upgrades
Starting from 2.4 release, NSX-T supports two upgrade modes, the maintenance upgrade mode and in-place upgrade mode. As to the maintenance upgrade mode, in addition to simplifying installation, Compute Managers also allow for upgrading hosts without impacting workload connectivity.
Cluster information read from the Computer Managers is leveraged by NSX to put hosts automatically into maintenance mode (workloads are migrated to additional resources and the original host gets empty). Only after that, NSX will update them, thus keeping workload connectivity at all times during host upgrades.
With the in-place upgrade mode, the workload VMs will not be migrated during the upgrade. The benefit of in-place upgrade mode is it takes less time to upgrade the host. The downside of the inplace upgrade mode is that the workload VMs might experience some packet lost.

4.1.1 Upgrade Coordinator
Upgrade Coordinator is a self-contained web application that runs on the NSX Manager and provides a single pane of glass for managing NSX upgrades. Key features are listed below.
• Checks existing version is upgradeable to the new one before starting the upgrade
• Allows to define upgrade plans for the different infrastructure components
• Performs upgrade in the correct order, ensuring stage success and managing retries of failed components
• Tracks and reports upgrade status
• Retains upgrade history
NSX upgrade utilities are available on System > Lifecycle Management > Upgrade, under the Upgrade tab.

Figure 4-1: NSX Upgrade Utility
Followings are to access Upgrade Coordinator:
- Download NSX Master Upgrade Bundle from https://my.vmware.com/:

Figure 4-2: NSX Master Upgrade Bundle
- On the NSX Manager UI, access Systems > Lifecycle Management menu, and on the Upgrade tab, click on PROCEED TO UPGRADE to upload the master upgrade bundle:

Figure 4-3: Uploading Master Upgrade Bundle
- Once the master upgrade file is uploaded, NSX presents a BEGIN UPGRADE button. Clicking on it starts the first step of the Upgrade Process, which is upgrading the Upgrade Coordinator itself:

Figure 4-4
- Once the Upgrade Coordinator is upgraded, the BUNDLE AND STATUS page is presented, where upgrade coordinator shows an overview of the system, reporting the issues it finds (if any):

Figure 4-5: Upgrade Coordinator Bundle and Status page
- Run re-check, fix any reported issues.
 Figure 4-6
4.1.2 Edge Upgrade

The Edge is the first NSX component to be upgraded after Upgrade Coordinator. Upgrade
Coordinator creates one Upgrade Group for each existing Edge Cluster, and it is not possible to move one Edge node from one group to another. Also, Edge nodes inside each group are upgraded in serial mode, this way only the upgrading node is down while all other nodes in the cluster remain active to continuously forward traffic. This setting is not customizable.
The Edge Upgrade page allows to customize the following upgrade options.
- Define upgrade order between Edge groups (parallel vs serial)
• Serial mode upgrades groups consecutively, one after another
• Parallel mode upgrades all groups simultaneously
- Decide if Upgrade Coordinator should pause automatically and when:
• When an upgrade unit fails to upgrade – This setting is checked by default and cannot be unselected for Edge upgrade. Upgrade will pause if any individual Edge upgrade fails.
• After each group completes – Upgrade pauses after each Edge group finishes upgrading
- Reorder upgrade sequence between groups
• Once an Edge group is selected, the ACTIONS menu allows to modify its upgrade order related to all other groups (Reorder)
• Alternatively, a “dotted icon” made of two columns of four periods each, will show up when hovering over the name of the Edge groups. Clicking on them, allows to drag the corresponding group out of his position, to drop it at a new one, highlighted by a green line with small green arrows at each end.
Click on “Start” to start Edge upgrade.

Figure: Edge Upgrade
 Figure 4-7
4.1.3 Host Upgrade
The Host Upgrade page allows to customize the upgrade sequence of hosts, disable certain hosts from upgrade, or pause the upgrade at various stages of the upgrade process.
Upgrade Coordinator creates a default Upgrade Plan that assigns hosts into different groups. On the default plan, vSphere and KVM hosts are assigned different groups. Additional groups can be created, and groups suggested by Upgrade Coordinator can be modified.

Host Upgrade customization options allow the followings:
- Define host to group membership
• By creating new host groups and assigning hosts to them
• By editing existing host groups and modifying their host membership

![]()
Note: When using Compute Managers, host groups are automatically created for the DRS enabled, vSphere clusters that are part of the upgrade. It is not possible to add other standalone vSphere hosts to such groups.
![]()
- Define upgrade order inside each group (parallel vs serial)
• Serial mode upgrades host inside the group consecutively—one after another
• Parallel mode upgrades host inside the group simultaneously

![]()
Note: When overall Parallel mode and host group Parallel modes are selected, some limits are enforced to guarantee NSX performance. Thus, not all hosts may be upgraded simultaneously. Please check the NSX-T Administration Guide to find the limits on each version.
![]()
- Define upgrade order between groups (parallel vs serial)
• Serial mode upgrades groups consecutively (i.e., one after another)
• Parallel mode upgrades all groups simultaneously

- Decide if Upgrade Coordinator should pause automatically and when:
• When an upgrade unit fails to upgrade – Upgrade pauses if any individual host upgrade fails. This selection allows admins to fix the error and resume the upgrade.
• After each group completes – Upgrade pauses after each host group finishes upgrading

- Reorder host upgrade sequence inside groups
• Once a host inside a host group is selected, the ACTIONS menu allows to change it to a different group or to modify its upgrade order inside the current one (Reorder)

Figure 4-11: Changing Upgrade Sequence of one host
Alternatively, a “dotted icon” made of two columns of four periods each, will show up when hovering over the name of the host groups:

By clicking on them, allows to drag the corresponding host group out of his position, to drop it at a new one, highlighted by a green line with small green arrows at each end:

Figure 4-13: Drag and Drop hosts
- Reorder upgrade sequence between groups
• Once a host group is selected, the ACTIONS menu allows to modify its upgrade order related to all other groups (Reorder)

Note that Set Upgrade Order option allows to set either Serial or Parallel upgrade mode for the hosts inside the group, but it does not influence the position on which the group will be upgraded (related to all other groups).
Alternatively, a “dotted icon” made of two columns of four periods each, will show up when hovering over the name of the host groups:

Clicking on them, allows to drag the corresponding host group out of his position, to drop it at a new one, highlighted by a green line with small green arrows at each end:

- Enable/disable groups from upgrade plan
• Once a host group is selected, the ACTIONS menu allows to set its state as Enabled (hosts inside the group will be upgraded) or Disabled (hosts inside the group will not be upgraded).

Once the required customizations are defined, the next step is to click on the start button for the upgrade to start.
Admins will be presented a warning message about the need of putting vSphere hosts into Maintenance Mode:

Requirements are:
• With maintenance mode upgrade:
- When using Compute Managers, vSphere hosts in clusters configured with fully automated DRS will be automatically put into maintenance mode, thus, no further action is required
- vSphere hosts not managed by Computer Managers, registered with NSX need to be put into Maintenance Mode manually, before starting the upgrade
• With In-Place upgrade o There is no requirement to migrate the VMs or put the hosts into maintenance mode or similar. A short traffic disruption may happen during the upgrade process. KVM only have In-Place upgrade mode.
Once requirements are fulfilled, admins can click on CONTINUE to start hosts upgrade. The overall progress bar, and host group specific progress bars, will indicate the evolution of the upgrade process. Admins can also click on PAUSE at any time to request the upgrade to stop. This manual pause request will not pause the hosts currently been upgraded, it will pause the upgrade process only after the in-progress hosts upgrade is complete (either succeed or failed).
Once the upgrade is paused, admins can modify the settings of their upgrade plan, if they want to.
8. Run Post Check to verify everything is OK after the upgrade.

![]()
Note: Upgrade Coordinator cannot proceed to the next step (i.e., Manager Upgrade) until all hosts are upgraded. Should there were issues preventing a successful upgrade of the Hosts, please contact VMware Support Services.
![]()
4.1.4 Manager Node Upgrade
The last step on the upgrade sequence is upgrading the NSX Manager. As in the case of the Controllers, the only available option is to start the Manager upgrade.
NSX Manager is rebooted during the process, thus its UI becomes inaccessible for some time. Note: As a best practice, it is recommended to ensure an update backup of the NSX Manager is available before starting its upgrade.

Figure 4-19: NSX Manager Upgrade
4.2 NSX Manager Backup/Restore
4.2.1 NSX Manager Backup
NSX includes the ability to backup and restore the Manager configuration, so that it can be recovered should it become inoperable for any reason. The NSX Manager stores the desired state for the virtual network. If it becomes inoperable, the data plane is not affected, but configuration changes cannot be made.
Backups are saved to a remote server using the SFTP protocol (SSH File Transfer Protocol). By design, the NSX Manager is not allowed to modify/delete existing backups on the destination server, thus, an automated task should be created on the server if deleting old backups and cleanup is required.
For better flexibility and ensuring that recent backups are always available, NSX offers the options to run manual and/or scheduled backups.
The Manager Backup comprises of three different types of backups, all of which happen automatically when scheduled configuration is selected:
• Node backups – include the NSX Manager appliance configuration
• Cluster backups – include the desired state of the virtual network
NSX Manager backup configuration is available under System > Lifecycle Management > Backup.


Figure 4-20: NSX Manager Backups
Note: The backup file will be created with the IP address of the manager node where the backup is performed. So you need to make sure to HTTPS to the individual IP address of manager node when you run the backup instead of using the cluster VIP.
4.2.2 NSX Manager Restore
Should the NSX Manager become inoperable, it can be recovered from a previous backup, if it exists.
A successful recovery requires the followings:
• The passphrase specified when the backup was created
• A new NSX Manager appliance, deployed with the same IP address or the same FQDN and software version than the one to be restored
![]()
Note: It is not supported to restore a backup on the same NSX Manager appliance where the backup was taken. Please see other important notes on the following link.
![]()
Once the new Manager appliance is deployed, admins must navigate to System > Tools > Utilities > Restore, and fill out the required backup server configuration.

Figure 4-21: Configuring NSX Manager Restore
NSX Manager reboots when restore is started. Once its GUI is responsive after reboot, log in and navigate to the Restore tab. If the hosts managed by the new NSX Manager are the same when the backup was taken, the restore process will proceed and finish successfully without further admin intervention:

Figure 4-22: Successful NSX Manager Restore
If the hosts managed by the new NSX Manager are different than the ones when the backup was taken, two things can happen:
- Fabric nodes were deleted since the backup was taken – At some point the restore process will pause and ask the admin to manually add them.

Figure 4-23: Fabric nodes that failed to discover the NSX Manager
Once they are added to the new NSX Manager, the admin must select I have finished all steps above and click on RESOLVE. The restore process will resume and finish successfully.

Figure 4-24: Fabric nodes that failed to discover the NSX Manager
- Fabric nodes were added since the backup was taken – the restore process will pause several times. On the first two pauses, the NSX Manager will ask the admin to run two different scripts, available in a specific directory of the nodes themselves:
- One will unregister the hosts as NSX Fabric Nodes
- The other will unregister the hosts as NSX Transport Nodes
Once the restore finishes successfully, the admin will need to add such nodes back to the new NSX Manager.

Figure 4-25: Fabric and Transport nodes that must be removed from the new NSX Manager
Then, the restore process will pause some more times to ask the admin confirmation before deleting the nodes from the NSX databases.

Figure 4-26: Restore process asking the admin for confirmation before proceeding
Once all steps are taken, the process will resume and will eventually finish successfully.

Figure 4-27: NSX Manager restore finished successfully
4.3 Support Bundle
When dealing with IT solutions, it is sometimes required to open a support case with the vendor and get the support logs/bundles from different components.
NSX provides a central location to collect support bundles from registered cluster and fabric nodes, and to download those bundles to the admin station or to have them automatically uploaded to a file server.
Support Bundle central collection location is available under System > Utilities > Support Bundle. Admins can select an arbitrary number of NSX components from different nodes (i.e., managers, controllers, edges, hosts, public cloud gateways) and get the logs from them all automatically.
Admins can specify if they want to include core and audit logs, and if they want to get all available logs or only the ones from a specific number of days.
![]()
Note: Core files and audit logs may contain sensitive information such as passwords or encryption keys.

When the option Upload bundle to remote file server is selected, the admin is requested to add details of such a remote file server.

Figure 4-29: Configuring support bundle to be uploaded to a remote file server
Once the bundle collection process concludes, there is no additional action required from the admin since the bundle is automatically uploaded to the server.

If no remote file server is configured, the admin must click on the DOWNLOAD button to have the bundle download into his/her laptop/station:

Figure 4-31: Download Support bundle to management laptop/station
4.4 Work with Services on NSX Managers
4.4.1 Use CLI to enable/disable services on the NSX manager
To start / stop a service on NSX manager, use NSX CLI
Start service Stop service
 Figure 4-32 Start service CLI
To set start a service on boot, use NSX CLI: set service

Figure 4-33 Set service CLI
4.4.2 Use UI to configure centralized node configuration
Syslog server and SNMP server can be configured use centralized node configuration. The configuration will be applied to all NSX managers.

5 Troubleshooting Tools & Case Study
This section describes the following tools:
- NSX Alarm / Event
- Logging, vRealize Log Insight and Splunk
- Port Connection Tool (available on Manager UI) and Traceflow
- IPFIX
- Port Mirroring (Local SPAN, L3 SPAN, Packet Captures)
5.1 NSX Alarm / Event
This section outlines NSX alarm/event.
5.1.1 Understanding Alarm & Event

Starting from NSX-T 3.0, NSX can alert as to alarming conditions by using the Alarms/Events framework. Each individual NSX component constantly scans and monitors their predefined alarm conditions. When the alarm condition occurs, the system emits event. The events will be sent to the NSX manager. The alarm instances can be viewed via the manager UI and can also be queried via NSX API. If Watchers are registered with NSX manager and they will receive notifications of alarms.
NSX can also integrate with existing monitoring infrastructure by sending out events via log messages to syslog or traps to SNMP server when an alarm condition occurs.
NSX-manager, Transport Node, Edge node, NCP and services like load balancer, firewall and VPN are the components that currently support the Alarm/Event framework.
5.1.2 Monitoring NSX with Alarm Dashboard
This section covers monitoring NSX with Alarm Dashboard.

The alarm dashboard shows all the alarm instances. From here, users can see which node generates the alarm, the severity of the alarm, last time the alarm being reported, and the state of the alarm.
Also, users can take action to acknowledge, resolve and suppress an alarm instance.
I want to mention that acknowledge and resolve will not make the alarm go away if the alarm condition still exists. Only when the real issue is resolved, the alarm can be in resolve state.
5.1.3 Pre-defined Alarm / Event in NSX Manager
This section outlines pre-defined Alarm/Event in the NXS Manager.

All the pre-defined alarms are listed under the Alarm definitions on the Manager UI.
More details of each alarm can be found here on the following link.
https://docs.vmware.com/en/VMware-NSX-T-Data-Center/3.0/administration/GUID-23FB78F5E0AF-40E3-9450-0B957B374383.html
5.1.4 Configuring Alarm / Event behavior
The alarm can be enabled or disabled which means the alarm condition will be monitored or not. Creating alarm means whether an alarm is going to be created when the alarm condition occurs. You can enable/disable SNMP traps. For some alarm, you can change threshold and sensitivity here.

5.2 Logging, vRealize Log Insight and Splunk
This section documents logging, vRealize Log Insight and Splunk.
5.2.1 Logging
The logging of NSX appliance and NSX components on KVM host follows the RFC 5424 format. The logging of NSX components running on ESXi hosts uses ESXi logging format.
RFC 5424 defines the following format for log messages as demonstrated below. <facility * 8 + severity> version UTC-TZ hostname APP-NAME procid MSGID [structured-data] msg

Which produces a sample log message like the following:
<187>1 2016-03-15T22:53:00.114Z nsx-manager NSX - SYSTEM [nsx@6876 comp="nsx-manager" errorCode="MP4039" subcomp="manager"] Connection verification failed for broker '10.160.108.196'. Marking broker unhealthy.
In NSX, the structured-data piece of every message includes the component (i.e., comp) and subcomponent (i.e., subcomp) information to help identify the source of the message.
NSX produces regular logs and audit logs (i.e., facility local6, which has a numerical value of
22). Also, all API calls trigger an audit log. The long audit logs split into multiple pieces. You can filter the logs with splitID to see all the pieces for the same log message. Here is an example.

NSX logs are stored in the directory /var/log, on all NSX appliances, ESXi hosts and KVM hosts.
There are several ways to access NSX logs:
- When logged in as admin on the NSX appliances – log messages can be accessed with the following CLI command
get log-file <auth.log | http.log | kern.log | manager.log | node-mgmt.log | syslog>
- On hosts and when logged in as root on the NSX appliances – log messages are available on the /var/log/ directory. There are multiple log files available and Linux commands like tac, tail, grep or more can be used.
- Configuring log forwarding to a remote syslog server – Remote logging is supported on NSX Manager, NSX Controller, NSX Edge, and hypervisors. It must be configured on each node individually. Be aware that, as previously stated, facilities local6 must be included to have relevant NSX log messages forwarded.
The following command will forward all INFO level logs, which will be fine for typical NSX deployments: set logging-server <SERVER-IP-ADDRESS> proto udp level info
ESXi and KVM hosts require different configuration procedures. Please check the NSX-T Administration Guide for further details about NSX logs.
- Configuring log filter
The messages sent to remote collector can be filtered, here is an example: set logging-server” command with options including level, facility, messageid, and structureddata
Nsx-mgr-01> set logging-server 1.1.1.1 proto udp level warning facility local6 messageid switching structured-data audit="true",comp="nsx-manager"
Notes:
- Logging needs to be configured individually on each device
- Remote logging level should be higher (number is smaller) than the local logging level
- That not all process/daemons currently support a CLI to change logging level, but most of them do
- Important logs:

Normally the user only needs to look at the syslog. Important messages from individual logs will be in syslog. Additional information might be available in individual logs. The “comp” and “subcomp” fields indicate the corresponding individual log,
For example, this message is in the syslog,
![]()
The subcomp is policy, you can go to policy.log to find more information in case there’s a need.

5.2.2 vRealize Log Insight
VMware provides an NSX-T Log Insight Content Pack that collects, consolidates and correlates NSXT information that is then displayed in vRealize Log Insight in an intuitive and easy-to-consume. The Content Pack includes multiple widgets and dashboards related to the different NSX-T networking services, including infrastructure, switching, routing, distributed firewall, DHCP and backup.
As a sample, the screenshot below shows traffic patterns through the distributed firewall.

Figure 5-1: vRealize Log Insight NSX-T Distributed Firewall Traffic
Users can create customize dashboard to monitor the pre-defined events.

Log Insight Content Pack also has built-in alerts which can be configured to send out notification via email.


A complete list of pre-defined alerts can be found here:
https://docs-staging.vmware.com/en/draft/VMware-NSX-T-Data-
Center/3.0/administration/GUID-8E3CA63B-71F8-4F47-88A6-DC5FA714DE8B.html
5.2.3 Splunk
VMware also provides a VMware-supported Splunk app for NSX-T. It is available at https://my.vmware.com/ . Once on the NSX-T Data Center product page, navigate to the Drivers & Tools tab:

Figure 5-2: Downloading VMware supported Splunk app for NSX-T
It includes the same widgets and dashboards than the NSX-T Log Insight Content Pack.

5.2.4 Logging recommendation
If Log Insight is used as the logging server, it’s recommended to use protocol “li” or “li-tls” since they are optimized for transfer the log messages to the Log Insight server.
5.2.4.1 Logging with Protocol li-tls:
Notes: If Log Insight doesn’t have a signed CA, this is an example on how to use OpenSSL on the NSX manager appliance to prepare for the certificate for Lab purpose only.
i) Private key for CA
ii) CA certificate (root certificate) iii) Private key for LogInsight server iv) Certificate for LogInsight server
Example showing the step to configure li-tls:
- On NSX manager, change to directory /image/vmware/nsx/file-store
- Create the private key for CA openssl genrsa -out ca_private.key 4096
- Create the CA certificate (root certificate) openssl req -new -key ca_private.key -x509 -out ca.crt -days 3650
- Create private key and certificate request for LogInsight server openssl req -new -nodes -newkey rsa:4096 -keyout LI.key -out LI.req
- Sign the certificate request for LogInsight server openssl x509 -req -in LI.req -CA ca.crt -CAkey ca_private.key -CAcreateserial -out LI.crt -days 3650 f. Put key and crt into pem file cat LI.key LI.crt ca.crt > LI.pem
g. To configure the server certificate on Log Insight, go to Administration → SSL and upload a new certificate file (LI.pem)

To configure logging-server with li-tls:
nsx-mgr-137> set logging-server 10.114.220.225:9543 proto li-tls level info serverca ca.crt
5.2.4.2 Logging with Protocol li-tls:
1) Notes: If Log Insight doesn’t have a signed CA, this is an example on how to use XCA to prepare for the certificate for Lab purpose only.
To download XCA tool: https://hohnstaedt.de/xca/index.php/download
Detailed manual is available at https://hohnstaedt.de/xca/index.php/documentation/manual
- In XCA create a new database at Files → New DataBase. If a database is already created, open it at Files → Open DataBase.
- In the Private Keys tab, create a Private key by clicking "New Key" and fill the required information.

- In the Certificates tab, create a root CA certificate by clicking "New Certificate" and fill the required information. Note that CRL Distribution Point (CDP) is mandatory because CRL checking is enabled by default on the NSX manager. If CDP is not available, refer to the next section "Disabling CRL checking" for details.


- Once the root CA certificate is created, select the created CA certificate and click "New Certificate" to create a leaf certificate that is signed by the root CA certificate:


- Export the keys and certificates have been created:

- Prepare for certification files will be needed by the LogInsight clients which are the NSX manager/Edge node/Transport Node and LogInsight server which is the LogInsight itself.
The certification file needed by the LogInsight client includes client certificate, CA certificate. The order of the certificates is important, the client certificate followed by CA certificate.
![]()
The certification file needed by the LogInsight server include private key of LI server, certificate of LI server and certificate of CA.
![]()
- For NSX manager, put the certificate and key files under /image/vmware/nsx/file-store. For Edge node, put the certificate and key files under /var/vmware/nsx/file-store. Make sure the files have corrected permission.

- Configure logging with TLS on NSX manager / Edge node ( LogInsight client )

- Configure Log Insight


- Verify Log Insight can receive the logs from the clients.

- To troubleshoot certificate issues, check the syslog to see any related error messages:

Notes on how to disable CRL checking:
The crl_checking_enabled flag is a part of SecurityGlobalConfig which is a part of api/v1/globalconfigsTo get the current SecurityGlobalConfig when logged into a manager:
root@manager1:~# curl -k -X GET -H 'accept: application/json'
![]() https://127.0.0.1/api/v1/global-configs/SecurityGlobalConfig -u 'admin:VMwarensbu_1' {
https://127.0.0.1/api/v1/global-configs/SecurityGlobalConfig -u 'admin:VMwarensbu_1' {
"crl_checking_enabled" : true,
"ca_signed_only" : false,
"resource_type" : "SecurityGlobalConfig",
"id" : "c80387b9-3c80-46ae-970d-6590d06acba8",
"display_name" : "c80387b9-3c80-46ae-970d-6590d06acba8",
"_create_user" : "system",
"_system_owned" : false,
"_create_time" : 1574364819458,
"_last_modified_user" : "system",
"_last_modified_time" : 1574364819493,
"_protection" : "NOT_PROTECTED",
"_revision" : 2 }
To update it when logged into a manager:
![]() root@manager1:~#curl -i -k -H Content-type:application/json -u 'admin:VMwarensbu_1' T CRL_FALSE https://127.0.0.1/api/v1/global-configs/SecurityGlobalConfig
root@manager1:~#curl -i -k -H Content-type:application/json -u 'admin:VMwarensbu_1' T CRL_FALSE https://127.0.0.1/api/v1/global-configs/SecurityGlobalConfig
where CRL_FALSE file will contain:
{
"crl_checking_enabled" : false,
"resource_type": "SecurityGlobalConfig",
"_revision" : 2
}
5.3 Connection Tools
Port Connection Tool and Traceflow are two great tools for troubleshooting communication between workloads running in NSX. They show real-time information of the topology and detect issues (if any), thus reduce the time it takes to find out what is preventing such communication. The following diagrams depicts a sample Network Topology.
5.3.1 Network Topology Tool

Network Topology provides an overview of the NSX environment. It can be exported as PDF as well.
5.3.2 Port Connection Tool
Port Connection Tool provides visual information of the logical and physical connectivity between the interfaces of two workloads running in NSX, including VMs and containers.
It shows a visual map with layers that display realized state data such workload information, Logical Port status and Tunnel-health status, representing hop by hop connectivity between various points in the path.
It is possible to click on any of the components in the visual output to reveal more information about them. If issues are found, the corresponding components are displayed in yellow or red.

Figure 5-4: Port Connection Tool visualizations, without and with port issues (resp.)
5.3.3 Traceflow
Traceflow takes troubleshooting a step further by injecting a packet at the logical port of the source workload and displaying the step-by-step path a packet takes until it reaches the destination workload. Admins can specify multiple characteristics of the packet to match their troubleshooting needs.

The trace packet traverses the logical switch overlay but is not visible to interfaces attached to the logical switch, meaning, no packet is delivered to the intended recipients. Traceflow output includes a table listing Observation Type (i.e., Delivered, Dropped, Received, Forwarded), Transport Node, Component, and the Port Connection Tool graphical map of the topology if unicast and logical switch are selected as destinations. By clicking on the components in the visual output reveals more information.

Figure 5-6: Traceflow output, delivered packet
In case of connectivity issues, the table of observations and the visual output may provide different information. In the example below, the diagram shows the physical and logical port connectivity between the source and destination workloads while Traceflow observations report that the packet being injected is being dropped by the distributed firewall rule ID 1031.

Figure 5-7: Traceflow output, distributed firewall dropping the packet
5.4 IPFIX

IPFIX stands for IP Flow Information eXport and IP stands for Internet Protocol. It is a standard protocol for the format and export of network flow information, which is collected by a remote IPFIX collector which typically displays the information in an easy-to-understand way.
When IPFIX is enabled in NSX, all configured host transport nodes send IPFIX messages to the collectors using port 4739. For ESXi hosts, NSX automatically opens port 4739. For KVM hosts, NSX does not automatically open the port, admins must manually open port 4739.
NSX supports IPFIX for switches and firewalls as listed below:
• For switches, network flow at VIFs (virtual interfaces) and pNICs (physical NICs) is exported • For firewalls, network flow that is managed by the distributed firewall component is exported. Also, NSX permits the use of different IPFIX collectors and configuration profiles for both switches and firewalls.

Please check the NSX Administration Guide for further details about IPFIX configuration.
5.5 Port Mirroring
NSX supports several types of port mirroring and offers flexibility for the admins to choose the one that fits better their troubleshooting/monitoring needs. NSX supports the following port mirroring types:
• Local SPAN – To be used when both NICs, source and destination of the mirroring session, are on the same Transport Node. It does support PNICs or VNICs as the source and only VNICs as the destination of the capture.
• Remote SPAN – It offers two variants:
- RSPAN Source Session - Mirror network traffic from virtual machine interfaces to specific physical NICs over RSPAN VLAN IDs
- RSPAN Destination Session - Mirror network traffic from RSPAN VLAN IDs to specific virtual machine interfaces.
Both require the use of an Encapsulation VLAN ID, and the original VLAN of the traffic being captured and be preserved.
• Remote L3 SPAN – Forwards captured traffic to a remote IP address (destination server), encapsulated in one of the three following protocols: o GRE o ERSPAN type two o ERSPAN type three
Configuration options vary depending on the selected encapsulation mode.
• Logical SPAN – Source and destination of the traffic being capture must reside on the same NSX Logical Switch. This mode of SPAN continues to work even in the event of VM VMotions.
![]()
Note: Configuration options and restrictions may vary depending on the selected mirroring mode. Please check NSX-T Administration Guide for details.
![]()
All Port Mirroring configuration options are available under Tools > Port Mirroring Session.

From the very same menu it is possible to review the details and/or delete the session once the relevant traffic has been captured.

5.6 Packet Captures
In case of troubleshooting or monitoring requirements, it is possible to capture data plane packets on NSX Transport Nodes (i.e., Edges, KVM hosts, ESXi hosts).
On KVM and Edge node, there is a common command, start capture, that can be leveraged on those Transport Nodes, though options may vary depending on the node types.

Figure 5-11: Packet Capture command outputs from different nodes
Packet capture commands allow to specify expressions or parameters so that only relevant traffic is captured.
On ESXi host, pktcap-uw is a powerful packet capture tool which captures packet at different points inside ESXi hosts and shows packet going through different processes on the data path.

Section 6.7 provides a packet capture case study with pktcap-uw.
Details of pktcap-uw can be found here, https://docs.vmware.com/en/VMwarevSphere/7.0/com.vmware.vsphere.networking.doc/GUID-5CE50870-81A9-457E-BE56C3FCEEF3D0D5.html
Captures can be saved into a file that can be copied to the administrator station for further analysis with tools like Wireshark.

Figure 5-12: Saving a Packet Capture to a file and copying it to a remote destination

Please check the latest VMware NSX-T Command Line Interface Guide available for further details.
5.7 Case Study – Troubleshooting Tunnel Issue
In NSX-T, Geneve Tunnel is used to carry overlay traffic. The tunnel status needs to be up for the overlay packets to move between hosts and Edge nodes. Tunnel down is an often-seen issue. BFD is used to detect the tunnel status. We will first understand how BFD works then we are going to show how to troubleshoot the issue step by step through 2 case studies.

Understand BFD
BFD is used to detect faults between VTEPs on two hosts or Edge nodes connected by the tunnel. BFD packet is encapsulated in GENEVE encapsulation with VNI 0.
After a BFD session is established, BFD control packets will be sent between two nodes periodically. If one side misses 3 consecutive BFD packets, the path will be marked down.
This is how BFD packet flow looks like. It helps to understand the state of the BFD session.


In this example, the VTEPs of ESXi Host-143 and ESXi Host-133 are on the same vlan and the tunnel is working fine. Here we provide a working packet capture to show how the correct packets look like at each point.
First, we identify the collecting points where we want to capture the packets. In this case, we will be capturing the packet at bule 1, 2, 3 and 4 and green 1, 2, 3 and 4.
On the source host, the original BFD packet can be captured at point 1, the encapsulated BFD packet can be captured at point 2.

On the destination host, the encapsulated BFD packet can be captured at point 3, the encapsulated BFD packet can be captured at point 2.


Similar packet trace for the other direction.


Tunnel down most often is caused by underlay IP connectivity issue, invalid setup or realization issue. In both cases, we can identify the issue by looking at BFD status, capturing BFD packet and checking corresponding log. The following case is an example of invalid setup. The Edge VM is on a Transport Node ESXi-143. The VTEP of the Edge VM is in Vlan50, the VTEP of the Transport Node is in Vlan100. A Router VM is on Transport Node ESXi-133 whose VTEP is also in Vlan100. The tunnel between Edge node and Transport Node 143 is down. The trace shows the BFD packet from Edge Node 141 can reach Transport Node 143 but not the other way around. The reason is that the BFD packet sending from ESXi-143 is going to a VTEP in Vlan50, but Transport Node ESXi-133 doesn’t have a VTEP in Vlan50, so the BFD packet is dropped by the VxLAN module.
There are troubleshooting steps to identify the issue,
1st, To verify IP connectivity between TEPs with vmkping.
vmkping ++netstack=vxlan 192.168.50.141
Notes: MTU issue could impact workload traffic but it will NOT cause the tunnel in down state
2nd, check BFD session status:
On Edge Node:
Edge7-141> get bfd-sessions | find Dest_port|Encap|address|State
Dest_port : 4784
Encap : vlan
Local_address : 192.168.50.141
Remote_address : 192.168.50.151
State : up
Dest_port : 3784
Encap : geneve
Local_address : 192.168.50.141
Remote_address : 192.168.100.143
State : down
On Transport Node:
[root@ESXi -133:~] nsxdp-cli bfd sessions list
Remote Local local_disc remote_disc recvd sent local_state local_diag client flap 192.168.100.133 e60e03bb 0 0 134981 down No Diagnostic vdl2 0 s
192.168.50.141
192.168.200.233 192.168.100.133 b9c7 ec6f abc5507a 135106 179012 init No Diagnostic vdl2 0 192.168.100.143 192.168.100.133 ba50e211 8757285e 41400 41392 up No Diagnostic vdl2 1 192.168.50.151 192.168.100.133 58143144 555005d8 141350 134938 init No Diagnostic vdl2 0
From the BFD session state, you can tell the which side doesn’t receive expected the BFD packets. The “init” of the local_state means the node has received the BFD packet from the remote peer, the “down” of local_state means the node didn’t receive any BFD packet from the remote peer.
2nd, Trace BFD packet
Identify the capture point for BFD packet from Edge-141 to ESXi-143. This is the working direction.


Packets captured at each point:


Identify the capture point for the BFD packet from ESXi-143 to Edge-141. This is the non-working direction.


3rd, Checking BFD counter and corresponding log


5.8 vRealize Network Insight
This section demonstrates how to use Network Insight to monitor and troubleshoot NSX.
To monitor NSX, the NSX manager dashboard shows of the events, properties, topology information of NSX management cluster.

The events are detected with the predefined health check rules. The health checklist was developed from the operational perspective based on common issues in customer deployments of NSX. Among those rules, some of them are computed by vRNI independently, while others are the result of querying NSX alarms with API. The alarm natively generated by NSX are all in NSX-T System Event.

We can view event details and configure how the notification should be sent out either via email or SNMP.
To send notification for the event computed by vRNI, click on more Option, then Edit Event. You can simply Enable Notification for this specific event.


To enable notification for a specific event in NSX-T system Events, search the event first then create the notification.


This is email notification that you will receive:

The complete list of events being monitored by vRNI is here:
https://docs.vmware.com/en/VMware-NSX-T-Data-Center/3.0/administration/GUID-7E5F74FB14A5-41B9-B806-E6B9AC30BF00.html
Appendix
i. Remote User Authentication and RBAC
NSX-T appliances have two built-in local users—admin and audit. Users cannot create additional local users. However, user can leverage their existing directory services to add remote users and assign role-based Access Control (RBAC) to the NSX-T management.
NSX-T provides the following options for remote authentication:
1- Integration with VMware Identity Manager (vIDM) / VMware Workspace One 2- Direct integration with LDAP server – Microsoft Active Directory (AD) or OpenLDAP.

Figure 0-1 RBAC
The NSX-T integration with VIDM/LDAP enables remote users from the organization’s user directory service to be mapped to a predefined RBAC role on NSX-T. NSX-T has 11 predefined RBAC roles across different feature verticals with NSX, as shown in the following table.

As an organization, you can leverage either of these remote authentication options based on your requirements. Direct LDAP integration is a straightforward option to operate, as you can leverage existing LDAP servers directly for NSX-T management. However, VIDM integration requires VIDM platform deployment on top of your existing directory service for user authentication. However, VIDM integration provides additional directory service options (in addition to AD & Open LDAP) and more advanced remote authentication options like 2-factor authentication, Single Sign-On, etc.
The following section covers More details for each of the options.
i. Direct Integration with LDAP Server (AD/OpenLDAP) for RBAC
The NSX direct LDAP integration provides a simple and easy to operate option for remote authentication and can be enabled using the following simple steps:
- Add Identity Source with Domain Name, Type, Base DN and Associated LDAP Server
• Supports - LDAP, LDAPS & ‘startTLS’ over LDAP.
• Three Identity Source/Domain supported.
• Granular Base DN options

- Assign RBAC Role to the “users or groups” from the configured domain
• Search for LDAP users/group by Typing in 3 characters
• User can have more than one RBAC role assigned, E.g., Network Engineer & LB Admin

Once a remote user or user group has been assigned with the RBAC role, the User can now use UI or API to manage and operate NSX-T.

ii. Integration with vIDM for RBAC
NSX-T integration with vIDM provides following benefits related to user authentication:
• Support for extensive AAA Systems, including o AD-based LDAP, OpenLDAP
- RADIUS
- SmartCards / Common Access Cards o RSA Secure ID
• Enterprise Single Sign-On o Common authentication platform across multiple VMware solutions o Seamless single sign-on experience
This section covers the main steps on NSX-T to integrate with vIDM and to configure roles that grant different privileges to different users/groups. However, this does not cover the deployment or configuration of VMware Identity Manager. Please refer to VIDM document for details.
Assuming that both NSX-T Manager and vIDM appliances are deployed, powered on and configured with the basic management details (IP address, admin users, etc.), the integration requires the following steps:
On VIDM Platform:
- Creating an OAuth client ID for the NSX-T Manager.
- Get the vIDM appliance thumbprint.
- Add an Active Directory (AD) server to vIDM as a user directory service.
On NSX-T Manager:
- Register NSX-T Manager with vIDM using the OAuth client ID created 5. Assign RBAC Role to the “users or groups” from the configured domain.
(ii) Registering NSX-T Manager with vIDM using the OAuth client ID created
Once the OAuth Client ID, Shared Secret and the vIDM thumbprint are available, NSX-T Manager can be registered with vIDM using following UI workflow:
1. Navigate to System -> Users and Roles -> VMWARE IDENTITY MANAGER 2. Click on the EDIT top right corner to register NSX-T manager with VIDM.

Enabling vIDM on NSX-T
- On the window that pops-up:
• Enable VMware Identity Manager Integration
• Enter the FQDN of the vIDM appliance
• Enter the OAuth Client ID created in vIDM previously
• Enter the Shared Secret associated with the OAuth Client ID
• Enter the SHA-256 thumbprint of the vIDM appliance obtained previously
• Enter the FQDN of the NSX-T Manager appliance • Click on Save

Configuring vIDM on NSX-T
![]()
Note: What is entered on the NSX Manager Appliance field must be used for accessing NSX after the integration. If the FQDN is used but then try to access the NSX Manager through its IP address, remote user authentication will fail with a “Must provide a matching redirect uri” error message.
![]()
- Back on the Configuration window, vIDM connection shows as Up and vIDM Integration as Enabled as shown in figure below.

NSX-T to vIDM Connection Up
- At this point, there is a successful communication between the NSX-T Manager and the vIDM appliance.
(iii) Configuring different roles in NSX-T for the users retrieved from AD via vIDM
Once vIDM has retrieved the specified users from Active Directory, we can assign them different roles in NSX. For that:
- On the NSX-T Manager UI, navigate to System -> User and Roles, and select the Users Click on the ADD -> Role Assignment for VIDM

NSX Users Role Assignments
- On the window that pops-up, select a remote user or group to be assigned a role. Typing in minimum three characters under user/Group, would automatically query configured VIDM/AD to get all possible user/group matching the given string. Select the user/group to assign one or more roles from the list. Click Save when finished.

NSX VIDM users Role assignment
- Repeat the process to assign roles to more users and/or groups

Configured Users with Role assignment
Note: Privileges are calculated per feature. Users with no explicit role assigned will inherit the role(s) of their group. Users with explicit roles assigned enjoy the highest privileges of any of them. A detailed list of Roles and Permissions is available on the NSX-T Admin Guide.
- Log out from the NSX web interface.
- After integration with vIDM, the NSX-T login page redirects to Workspace login page. Login with remote user with correct system domain.

Login into NSX with a remote user
- Once authentication is successful, the user is taken to the NSX home page.

Successful Remote User login
ii. NSX Certificate management
As part of security compliance many organizations want to replace certificates with organization’s CA signed certificate on all of the systems/devices/appliances deployed in their environment.
This section will cover what are the different NSX-T platform certificates and how these can be replaced with CA signed certificate for compliance adherence.
NSX Certificates Type
NSX uses multiple self-signed certificate (X509 RSA 2048/SHA256) for both External & Internal communication. Only, External (UI/API) & Inter-site certificates (NSX federation) can be replaced by user (API only) with another o Self-Signed-Cert on NSX
o Imported Certificates signed by CA
NSX Internal certificates are not exposed or replaceable by user with NSX-T 3.0 release. The following Figure provides the list of External certificates and its details for a given three node NSX Manager cluster.

On a standalone NSX manager cluster you would have following certificates exposed to user and can be replaceable:
- NSX Manager Cluster/VIP certificate- Used with Cluster Virtual IP and one certificate per Cluster.
- NSX Manager Node certificate – This is used with individual Manager node IP and will be one per manager node.
The other two certs shown are used with NSX Federation solution. However, this is exposed on a standalone NSX manager as well, which do not have to be part of Federation. These certificates are not used in a non-federated environment.
- NSX Federation PI (Principal Identity Cert)- This is used between NSX Global manager and Local manager.
- NSX APH-AR certificate- used for inter-site communication when federation is enabled
i. Replacing Self Signed Certificate with CA signed Certificate
NSX certificate can be replaced with CA signed certificate using following steps:
1- Import CA signed certificate. – As shown in the figure make sure to copy certificate chain in following order: “Leaf – Intermediate –Root Cert”

2- Replace Self-Signed certificate with imported CA signed certificate. The NSX Certificate replacement is supported using following API workflow. UI support is not available as of NSXT 3.0.
- Get Certificate ID of the new certificate from the NSX UI or API.

- Validate the certificate using following API:
GET https://<nsx-mgr>/api/v1/trust-management/certificates/<certificate-id>?action=validate
- To replace NSX Manager CLUSTER/VIP certificate use following API. This API call can be done to any of the Nodes in the cluster.
POST https://<nsx-mgr>/api/v1/cluster/api-certificate?action=set_cluster_certificate&certificate_id=
<certificate-id>
- To replace NSX Manager NODE certificate use following API. Since it is node specific certificate replacement, This API call needs to go to individual NSX manager for which you want to replace the certificate.
POST https://<nsx-
mgr>/api/v1/node/services/http?action=apply_certificate&certificate_id=<certificate-id>
This completes certificate replacement workflow, and NSX manager starts using new CA signed certificate when user access the NSX manager UI or API.
Regarding NSX federation certificate replacement which are exposed on NSX manager even in nonfederated environment, only PI certificate can be replaced with NSX-T 3.0 release. APH-AR cert replacement will be supported in later releases. User can use following API call to replace NSX Federation PI Certificate.
POST https://<nsx-mgr>/api/v1/trust-management/certificates?action=set_pi_certificate_for_federation
{
"cert_id": "77c5dc5c-6ba5-4e74-a801-c27dc09be76b",
"service_type": "LOCAL_MANAGER"
}
