
Day 2 Operation - Splunk and Log Insight configuration
DAY 2 OPERATION
Setting up Logging, vRealize Log Insight
and Splunk plugin for NSX-T 3.x
Logging in NSX-T
NSX components, including those running on ESXi hosts, produce log messages that follow the RFC 5424 format. Log messages from KVM, on the other side, follow the RFC 3164 format.
RFC 5424 defines the following format for log messages:
<facility * 8 + severity> version UTC-TZ hostname APP-NAME procid MSGID [structured-data] msg
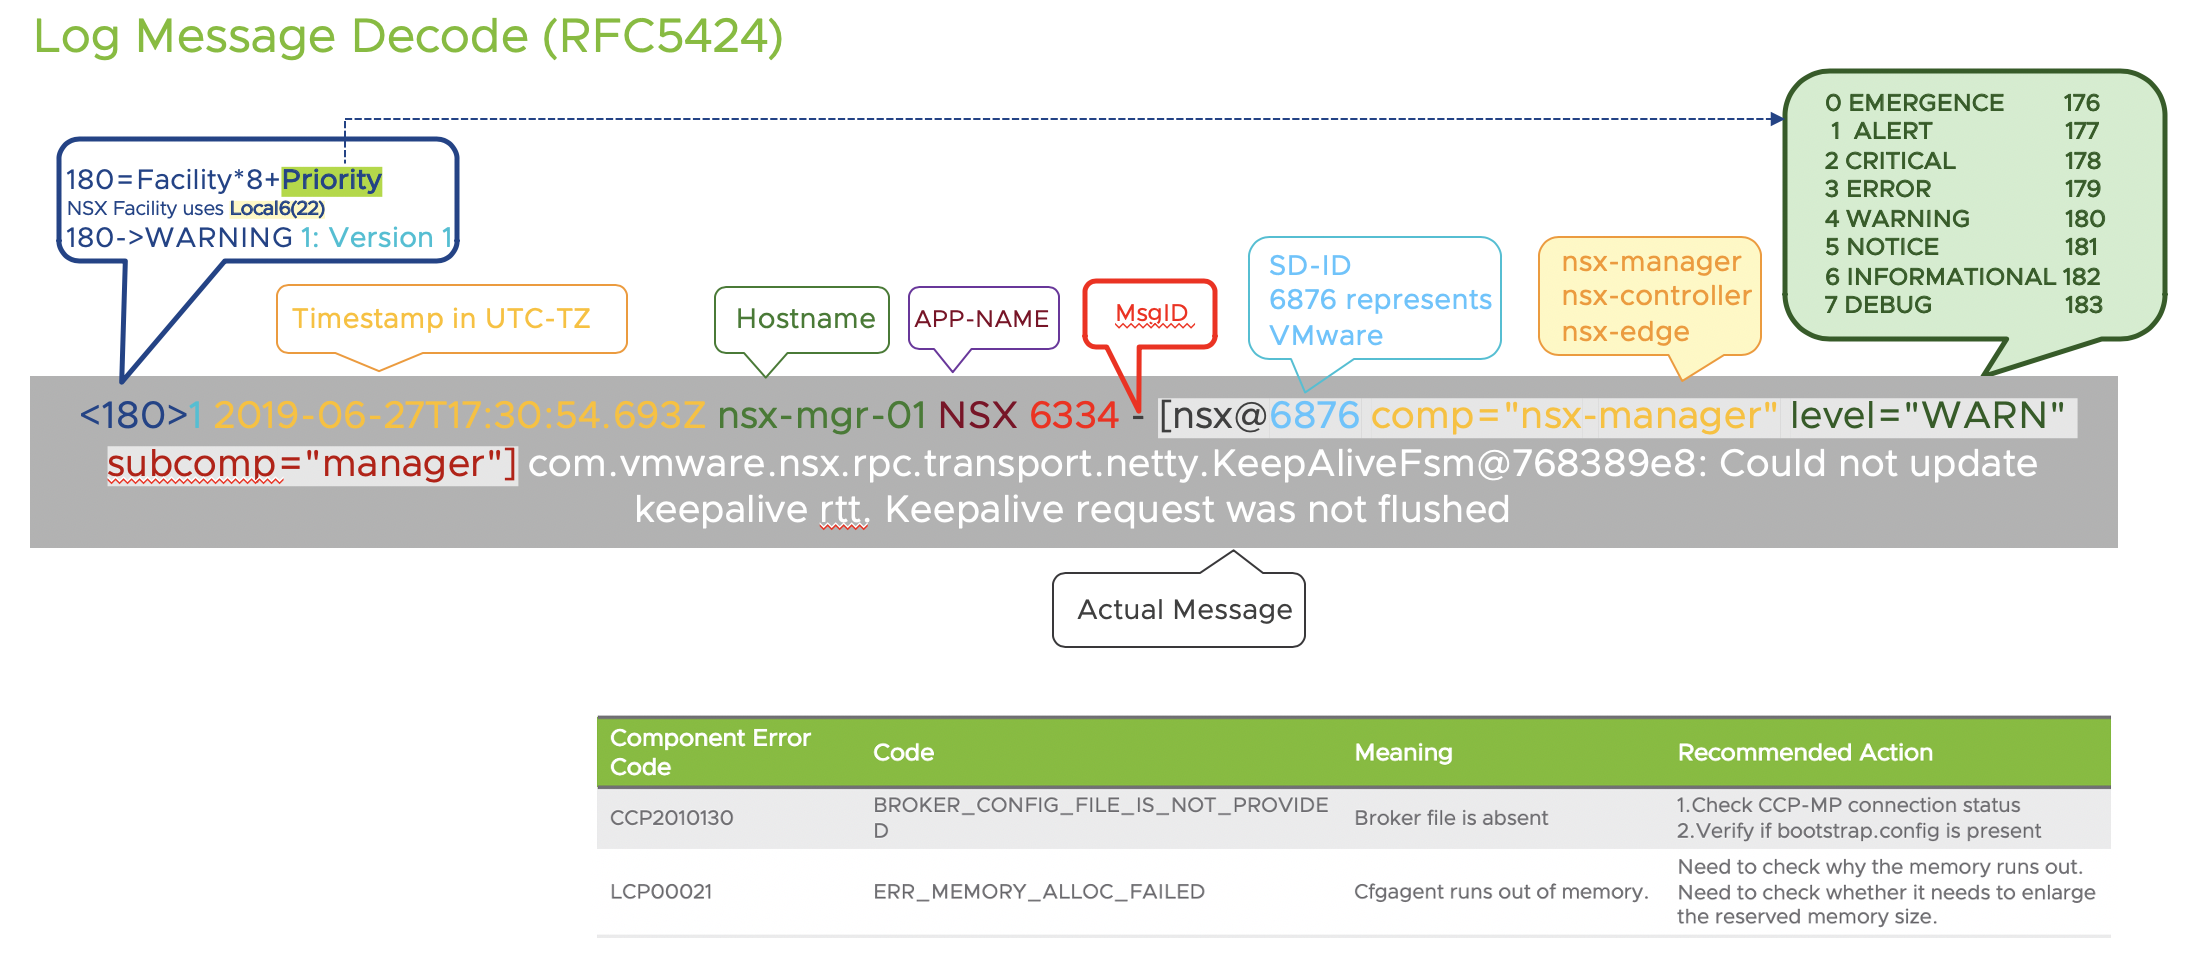
Which produces a sample log message like the following one:
<187>1 2016-03-15T22:53:00.114Z nsx-manager NSX - SYSTEM [nsx@6876 comp="nsx-manager" errorCode="MP4039" subcomp="manager"] Connection verification failed for broker '10.160.108.196'. Marking broker unhealthy.
In NSX, the structured-data piece of every message includes the component (comp) and sub-component (subcomp) information to help identify the source of the message.
NSX produces regular logs (facility local6, which has a numerical value of 22) and audit logs (facility local7, which has a numerical value of 23). Also, all API calls trigger an audit log.
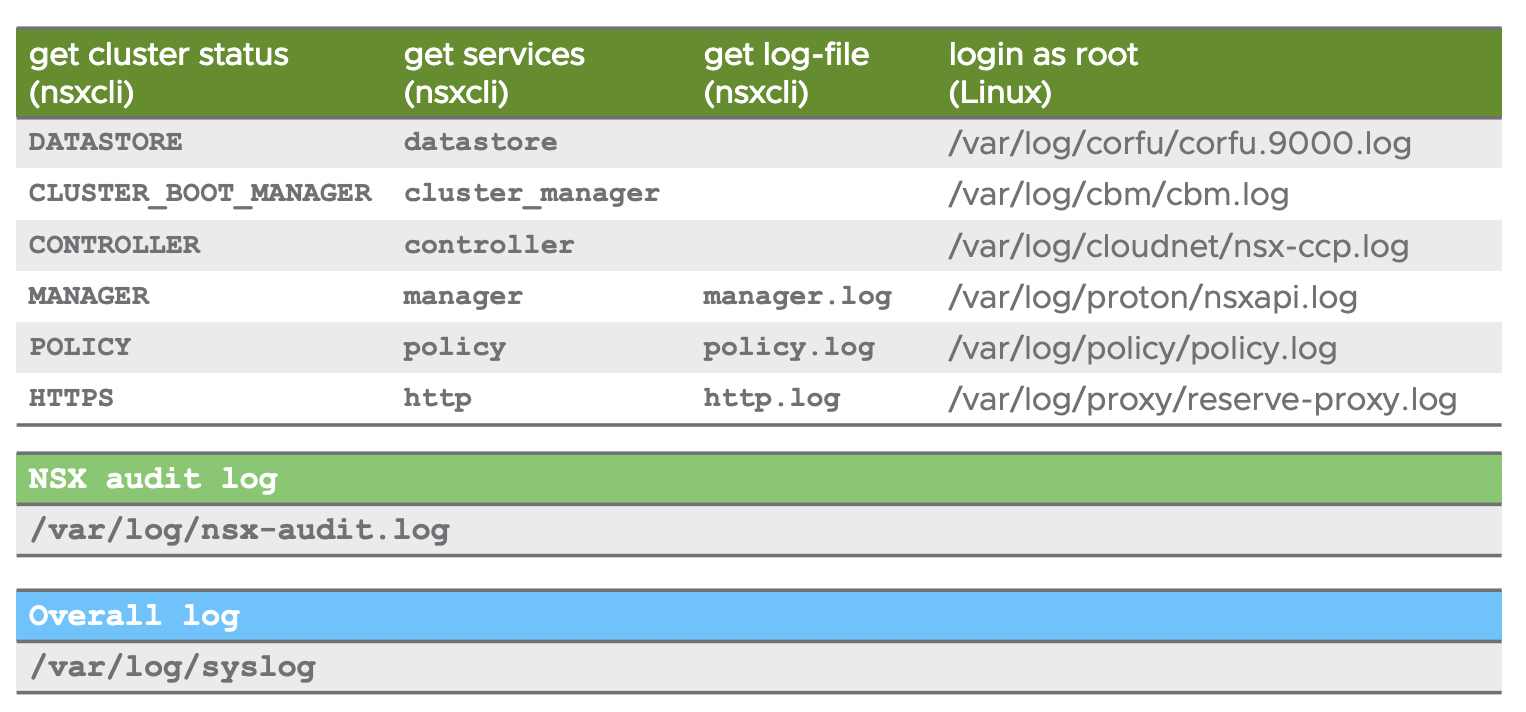
NSX logs are stored in the directory /var/log, on all NSX appliances, ESXi hosts and KVM hosts. There are several ways to access NSX logs:
When logged in as admin on the NSX appliances
Llog messages can be accessed with the following CLI command
get log-file <auth.log | http.log | kern.log | manager.log | node-mgmt.log | syslog>
On hosts and when logged in as root on the NSX appliances
Log messages are available on the /var/log/ directory. There are multiple log files available and Linux commands like tac, tail, grep or more can be used.
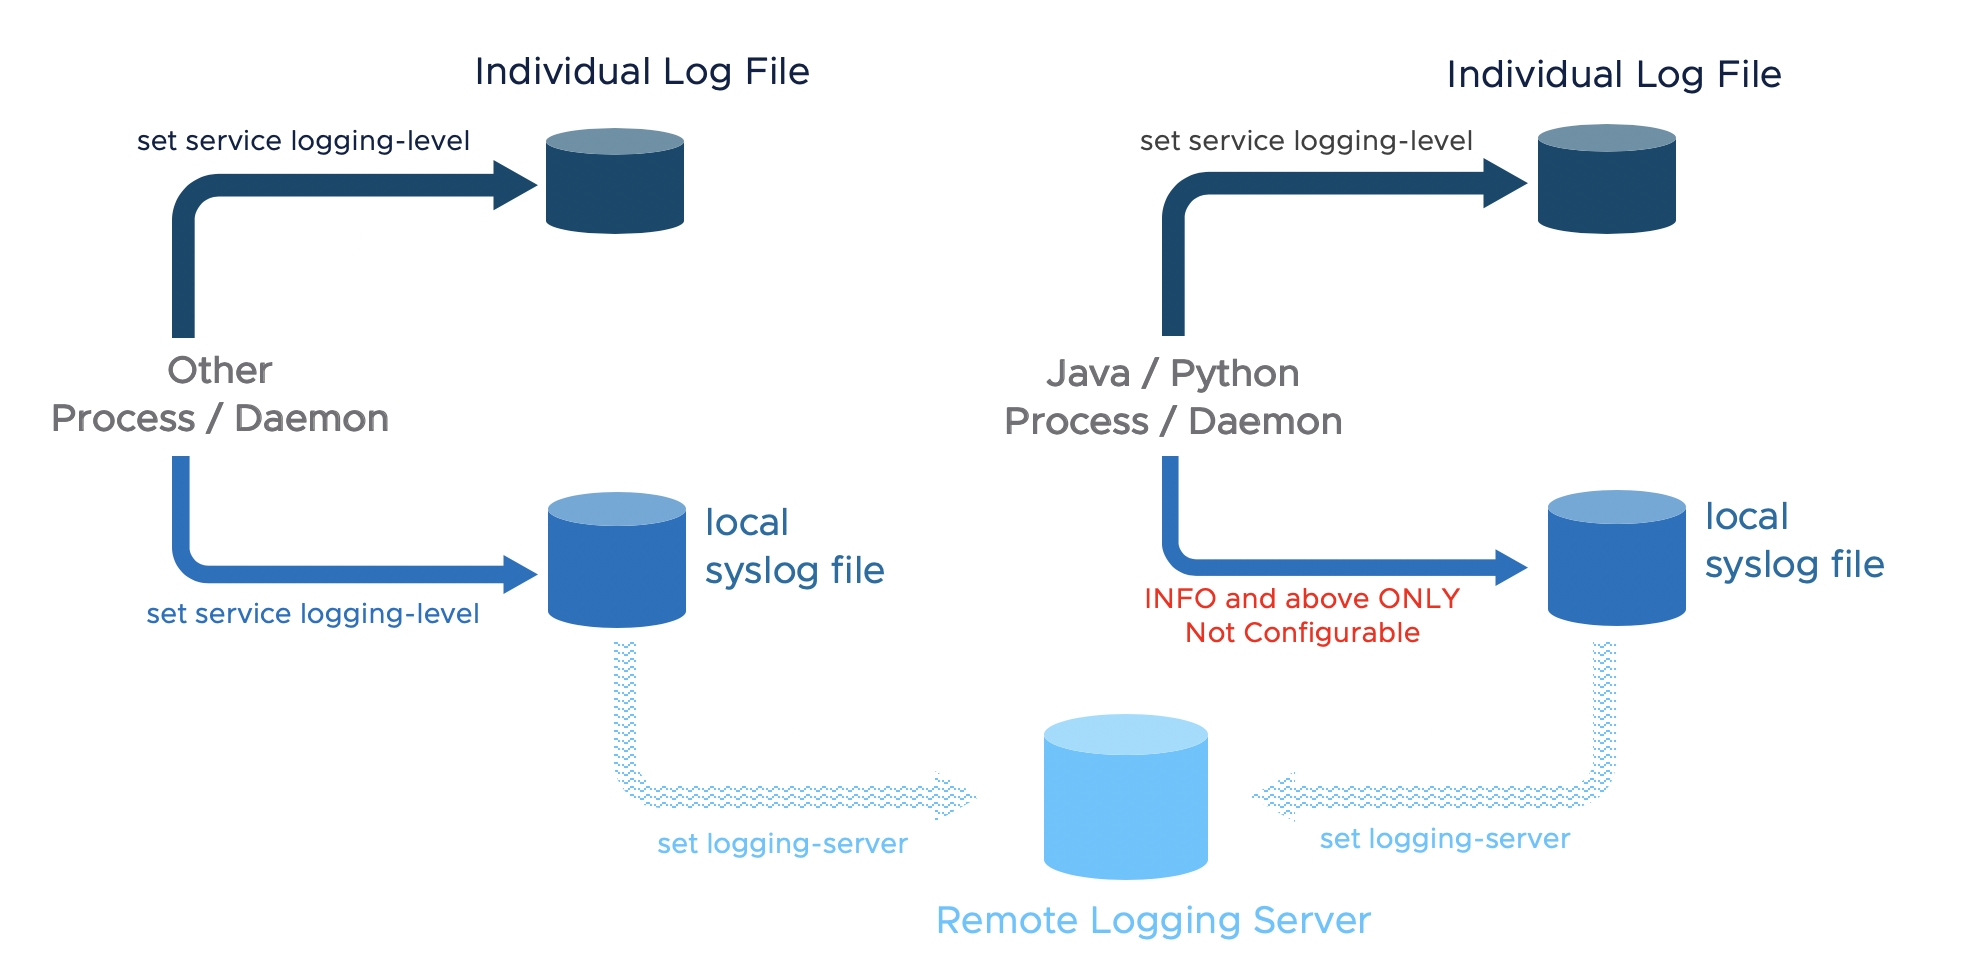
Configuring log forwarding to a remote syslog server
Remote logging is supported on NSX Manager, NSX Controller, NSX Edge, and hypervisors. It must be configured on each node individually. Be aware that, as previously stated, facilities local6 must be included in order to have relevant NSX log messages forwarded. Also, NSX log messages include a message ID field that allows to filter which messages are sent to a specific syslog server.
The following command will forward all INFO level logs, which will be fine for typical NSX deployments: set logging-server <SERVER-IP-ADDRESS> proto udp level info
ESXi and KVM hosts require different configuration procedures. Please check the NSX-T Administration Guide for further details about NSX logs.
Configuring log filter
The messages sent to remote collector can be filtered, here is an example:
set logging-server” command with options including level, facility, messageid, and structured-data
Nsx-mgr-01> set logging-server 1.1.1.1 proto udp level warning facility local6 messageid switching structured-data audit="true",comp="nsx-manager"
Notes:
- Logging needs to be configured individually on each device
- Remote logging level should be higher (number is smaller) than the local logging level
- That not all process/daemons currently support a CLI to change logging level, but most of them do
Important logs:
vRealize Log Insight
VMware provides a NSX-T Log Insight Content Pack that collects, consolidates and correlates NSX-T information that is then displayed in vRealize Log Insight in an intuitive and easy-to-consume way.
The Content Pack includes multiple widgets and dashboards related to the different NSX-T networking services, including infrastructure, switching, routing, distributed firewall, DHCP and backup.
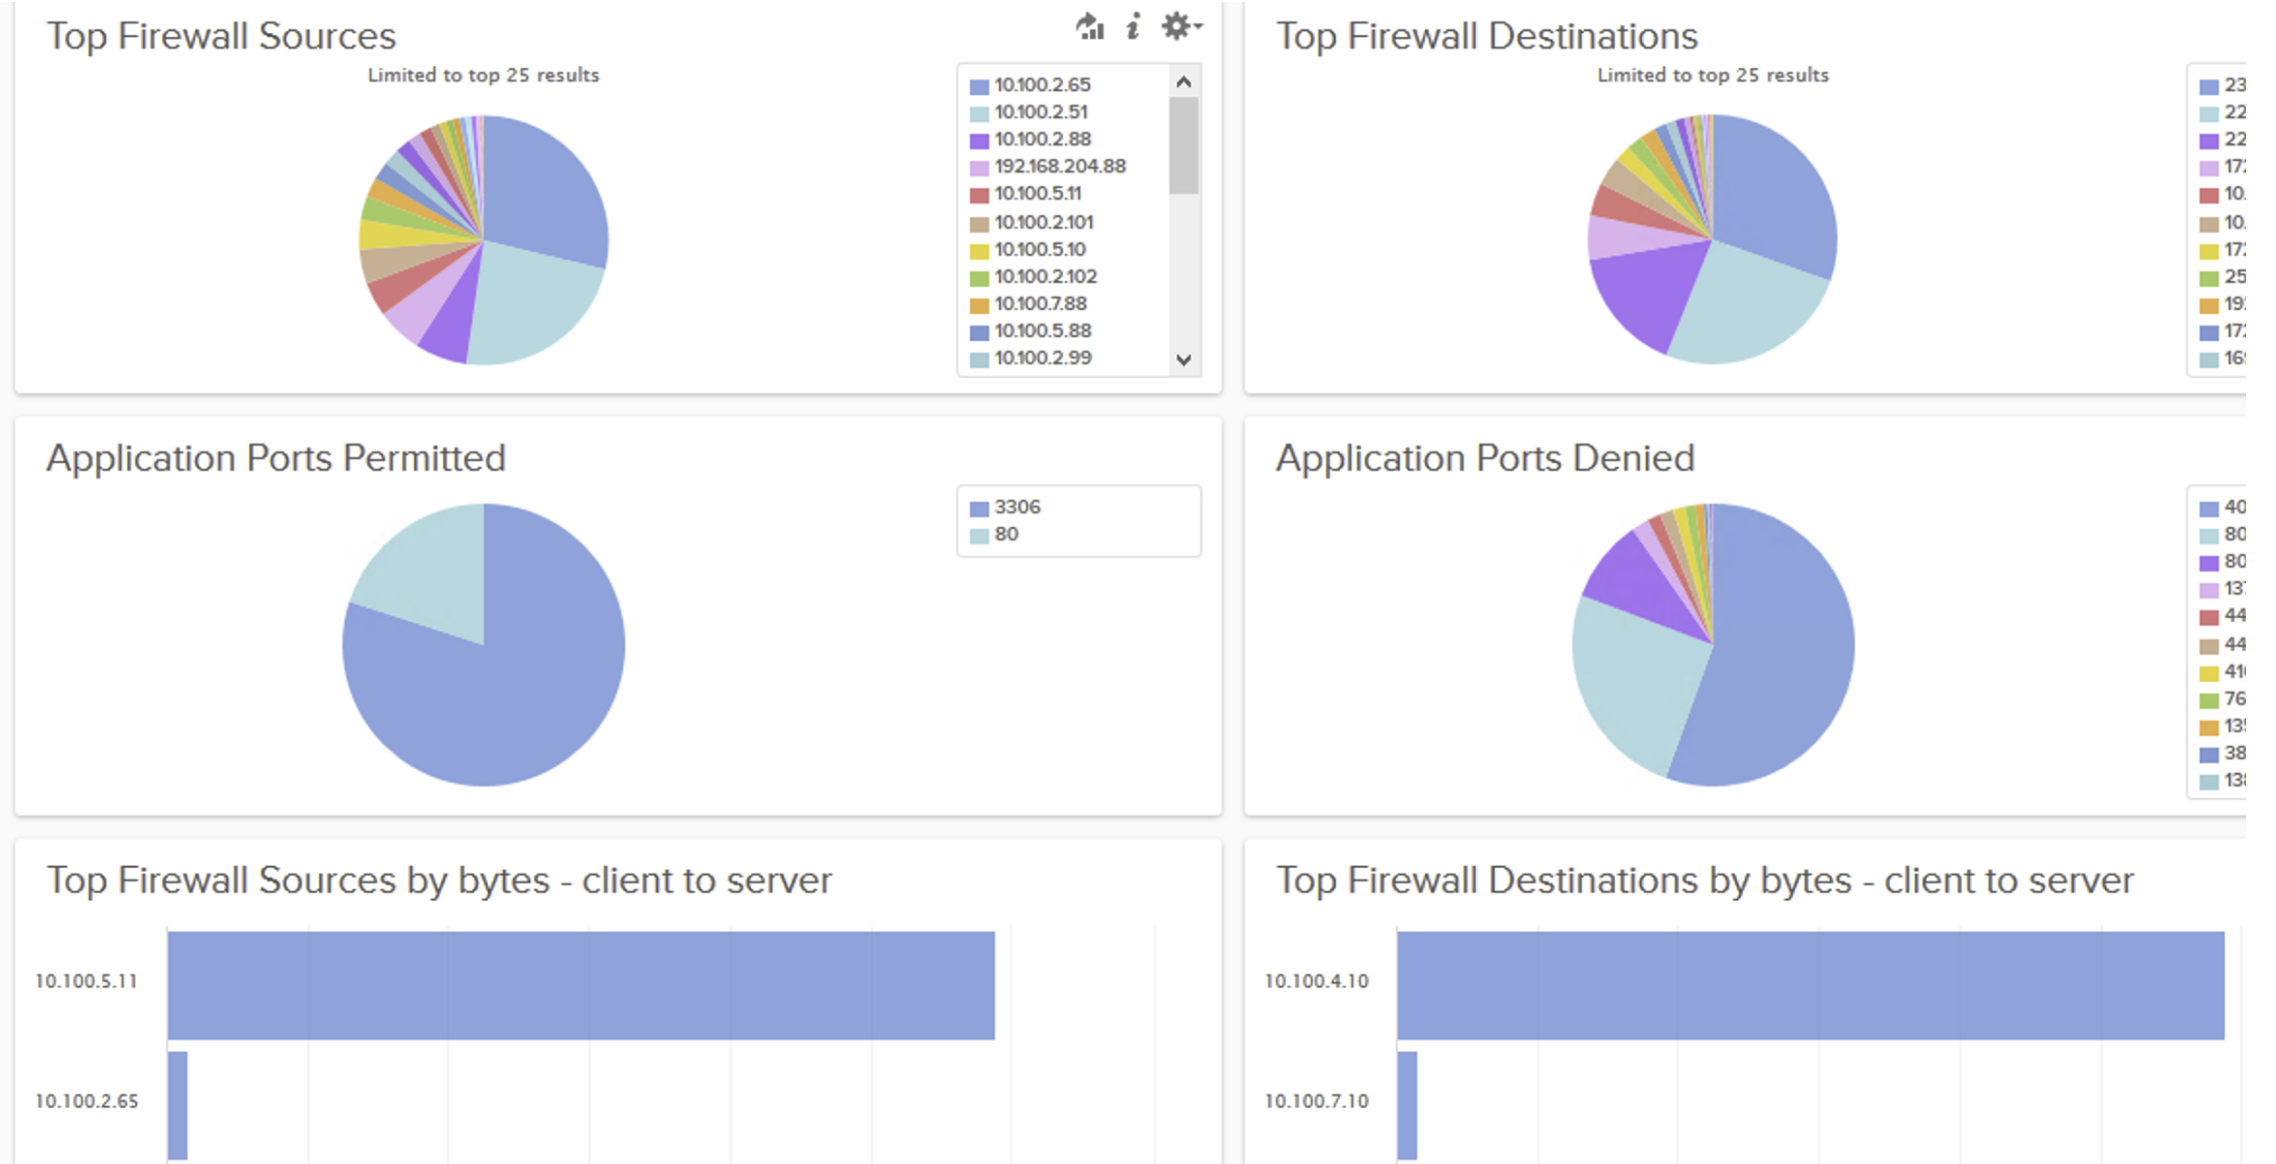
As a sample, the screenshot below shows traffic patterns through the distributed firewall.
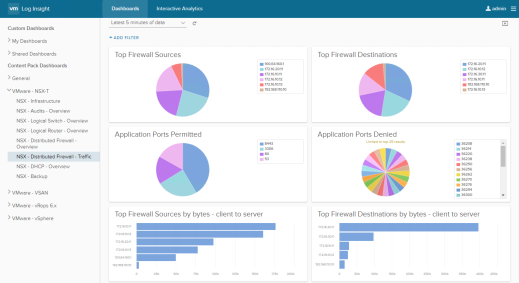
Figure 118: vRealize Log Insight NSX-T Distributed Firewall Traffic
You can create customize dashboard to monitor the pre-defined events:
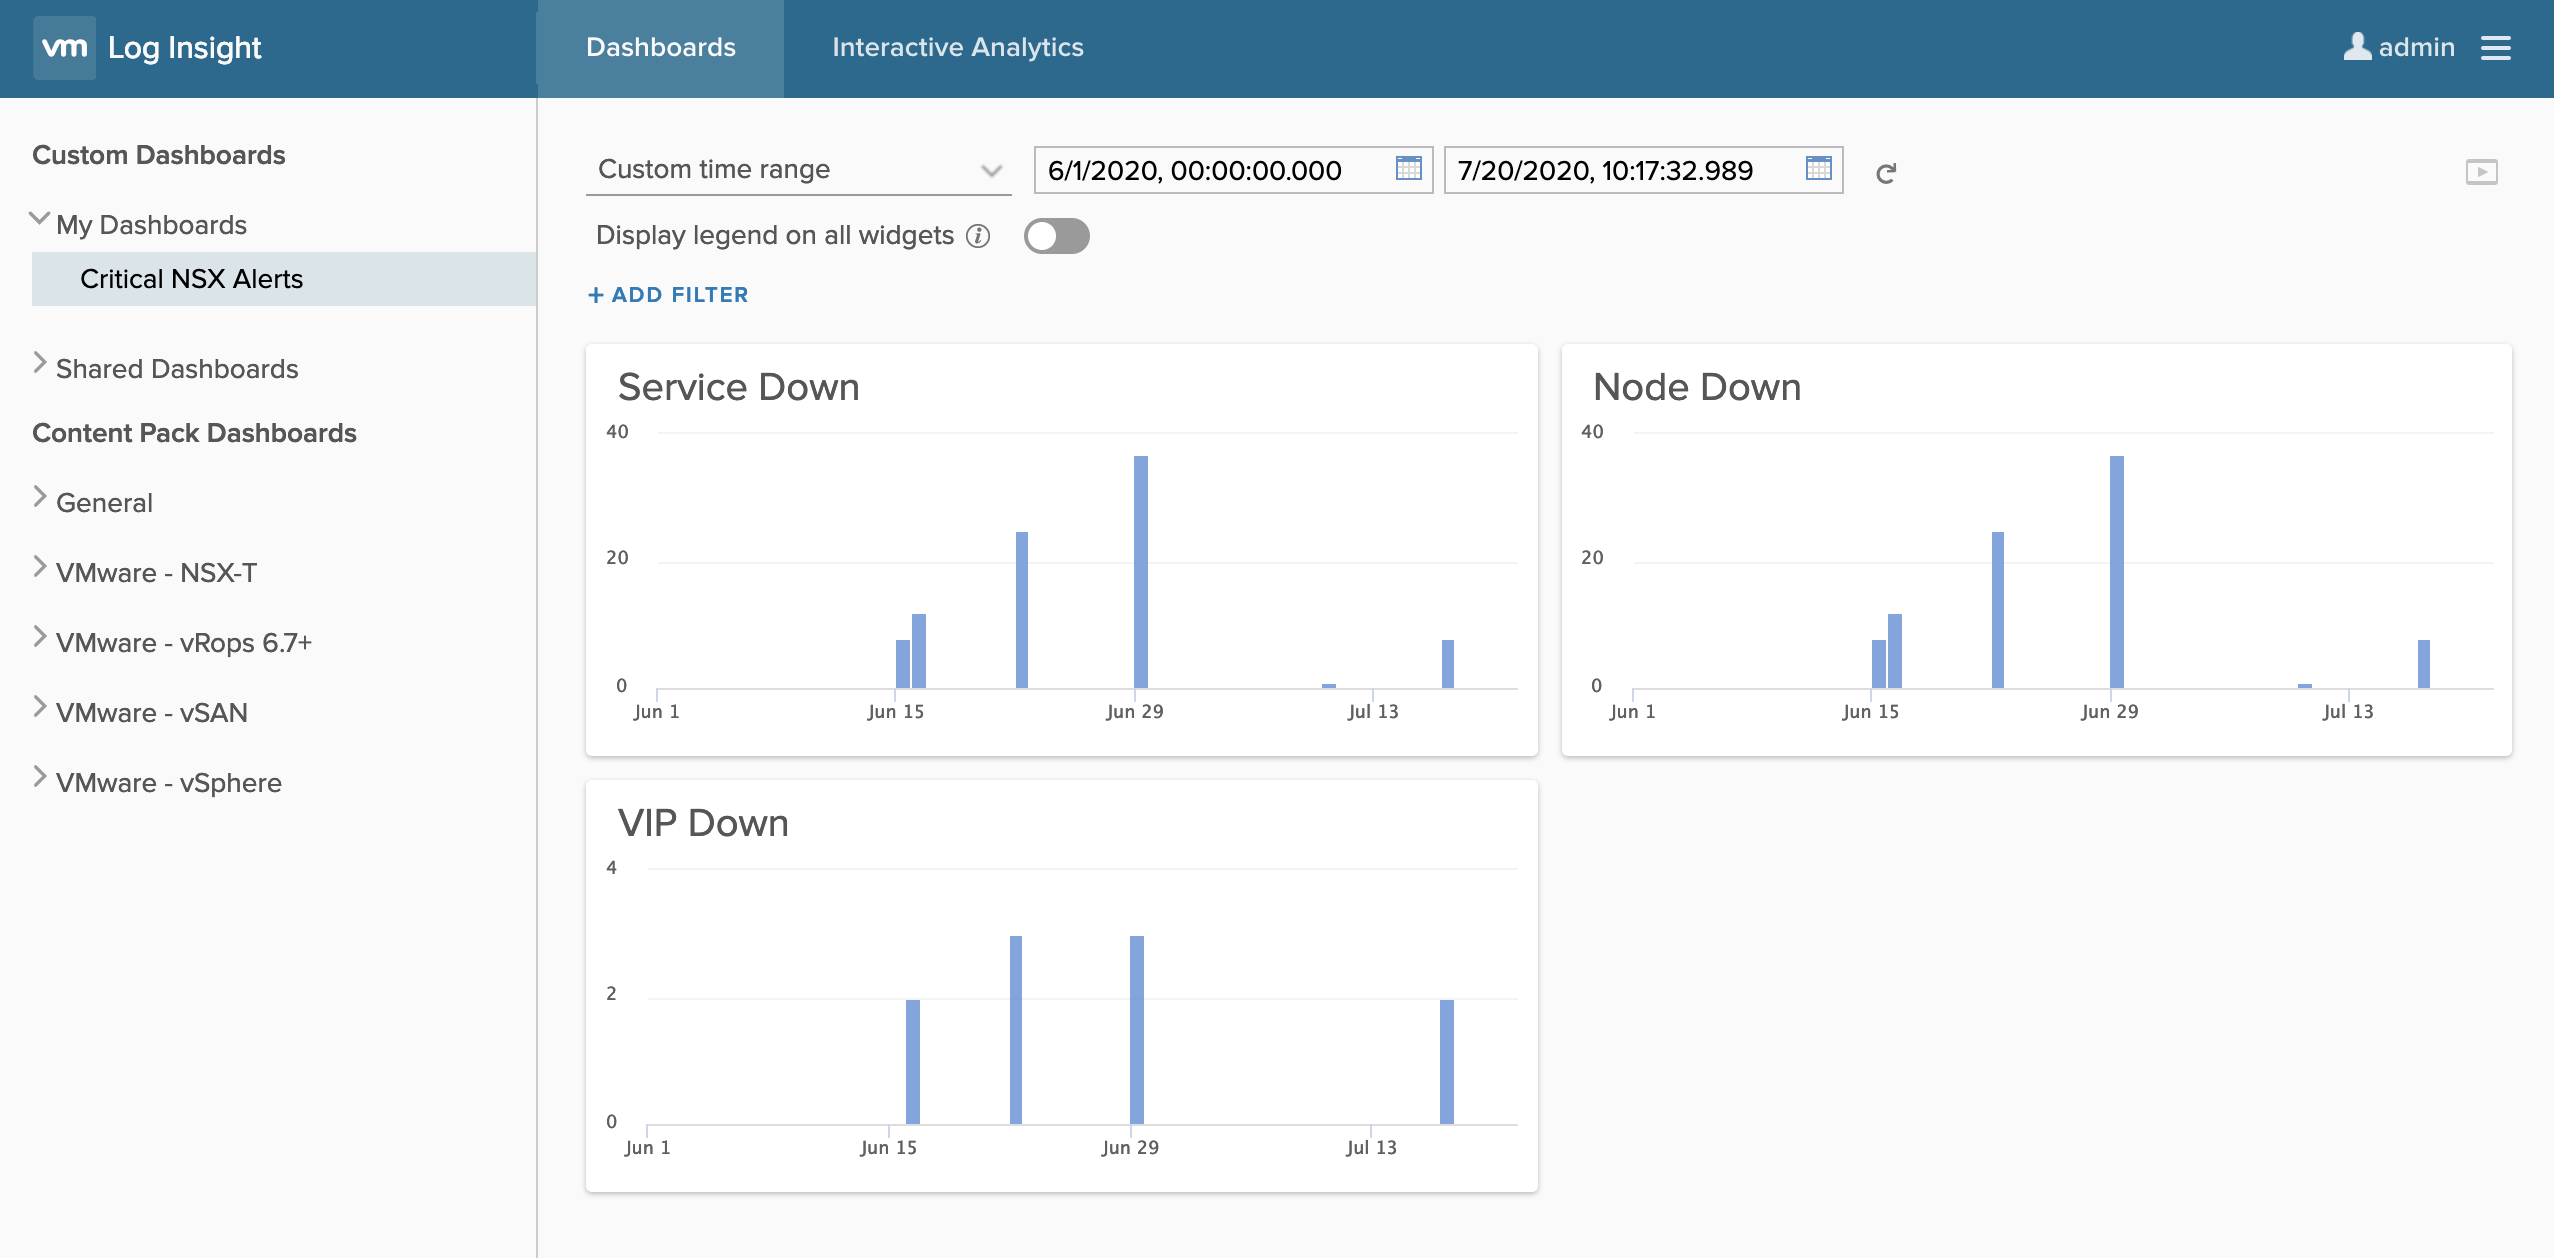
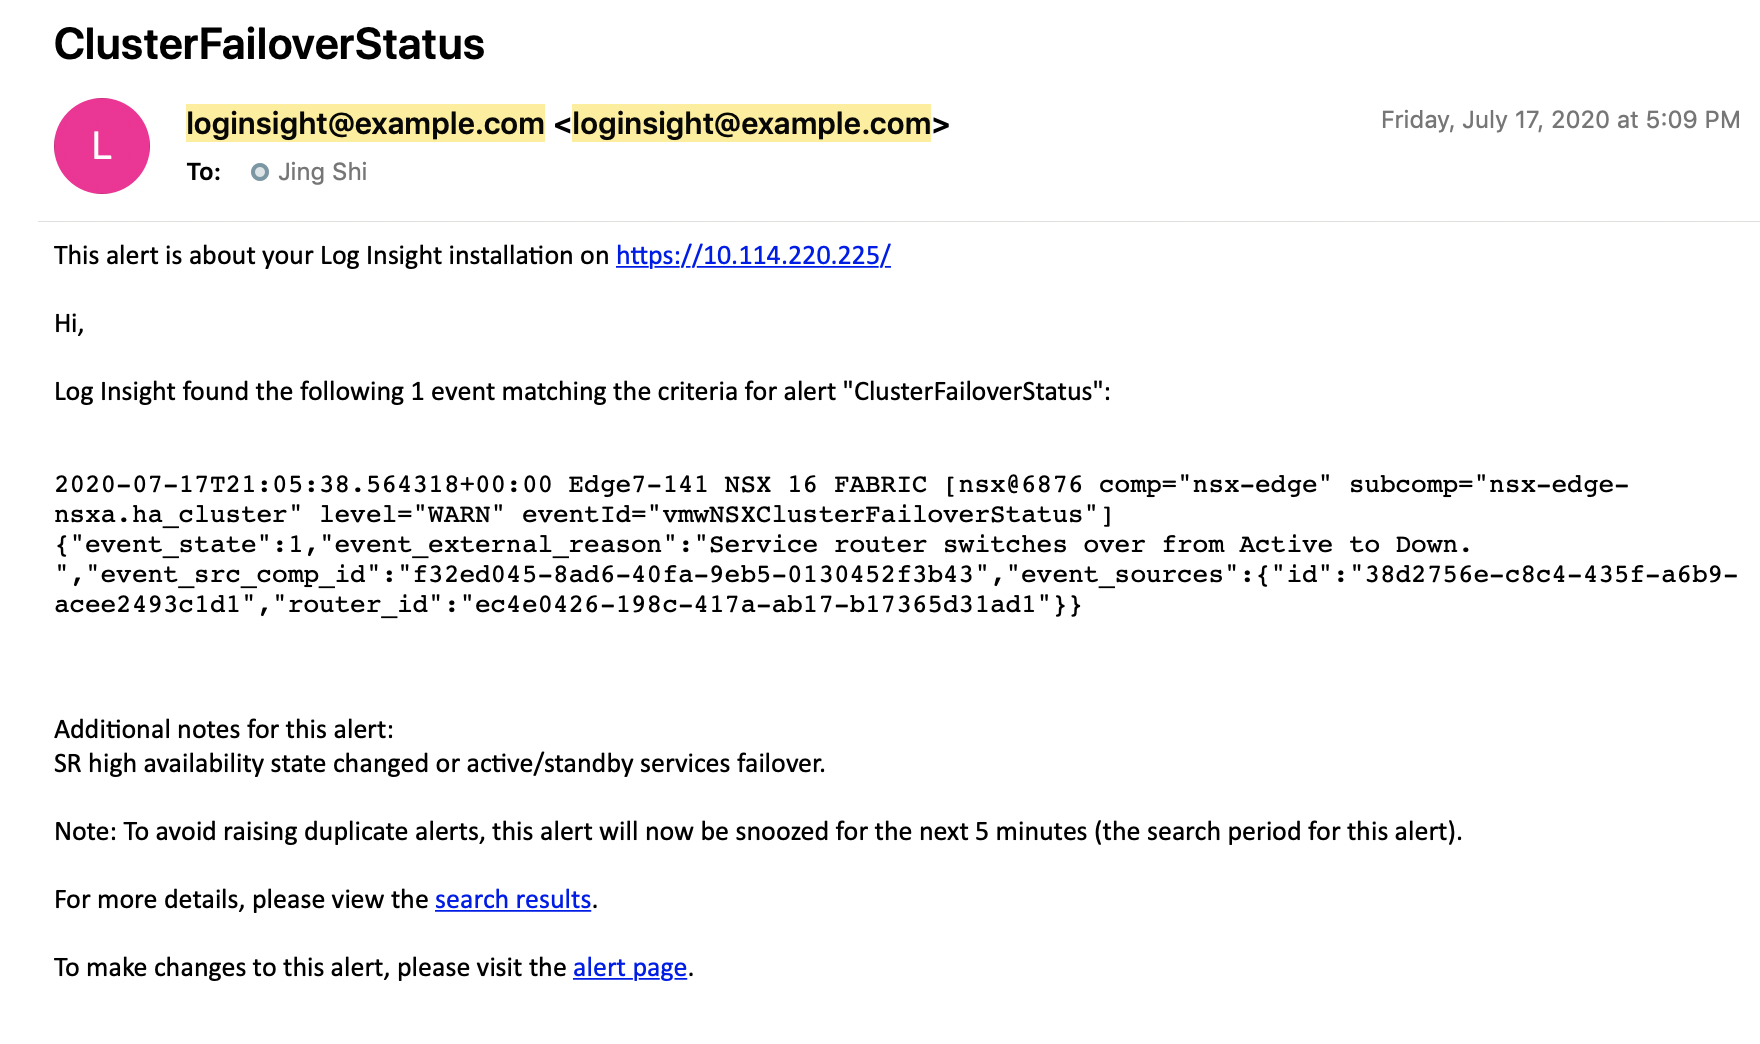
Log Insight Content Pack also has built-in alerts which can be configured to send out notification via email.
Example of Topology for Log configuration in NSX-T
Below you will find the topology we are testing with.

We have used a vRealize Log Insight Server that is not displayed on the drawing to sent our log messages to.
Enable logging on the NSX-T Manager
Before we start we first want to get something out of this world. When you configure the required Syslog commands on the NSX-T Manager the Manager will NOT push the logging servers to the Edge Transport Nodes or on the Transport Nodes. When we configure logging on the manager this will only provide information on what is happening on the manager.
When you have a manager cluster you set up an SSH session to the VIP and you put in these commands:
nsxapp-01a> set logging-server 192.168.110.24 proto udp level info
WARNING - You are configuring udp-based log forwarding. This will send sensitive information unencrypted over the network. The Splunk App for NSX-T only accepts TLS connections.
nsxapp-01a> get logging-servers
192.168.110.24 proto udp level info
When we have put in these commands we can see the following messages showed up in the Logging Server:

The SOURCE of this logging messages is the NSX-T Manager itself where the log message is initiated from.
It is also possible to send a certain type of messages to the logging server and this is done by configuring a "messageid".
nsxapp-01a> set logging-server 192.168.110.24 proto udp level info messageid FIREWALL,FIREWALL-PKTLOG
WARNING - You are configuring udp-based log forwarding. This will send sensitive information unencrypted over the network. The Splunk App for NSX-T only accepts TLS connections.
This will only send out a specific type of logging messages to a specific logging server. You can find out more on the about messageid's types here
Enable logging on the Edge Transport Nodes (Edge VM's)
In order to receive logging messages from our T0 and T1 Gateways, we also need to enable logging on the Edge Transport Nodes. We want to stress one more time that the logging server is NOT pushed automatically on the Edge Transport Nodes by the manager.
edgenodi-01a> set logging-server 192.168.110.24 proto udp level info
WARNING - You are configuring udp-based log forwarding. This will send sensitive information unencrypted over the network. The Splunk App for NSX-T only accepts TLS connections.
edgenodi-01a> get logging-servers
192.168.110.24 proto udp level info
We have enabled the Gateway firewall and configured a rule with a tag + logging enabled for testing purposes.


And we did a ping test from the "outside" world into the "NSX" world:
C:\Users\Administrator>ping 172.16.20.11
Pinging 172.16.20.11 with 32 bytes of data:
Reply from 172.16.20.11: bytes=32 time=46ms TTL=61
Reply from 172.16.20.11: bytes=32 time=6ms TTL=61
Reply from 172.16.20.11: bytes=32 time=6ms TTL=61
Reply from 172.16.20.11: bytes=32 time=6ms TTL=61
Ping statistics for 172.16.20.11:
Packets: Sent = 4, Received = 4, Lost = 0 (0% loss),
Approximate round trip times in milli-seconds:
Minimum = 6ms, Maximum = 46ms, Average = 16ms
C:\Users\Administrator>
And the logging messages appear nicely in our logging server

We have also simulated a BGP peer disruption and this also appeared nicely in our logging server:
Here you see the BGP peer is ESTABLISHED:
edgenode-01a(tier0_sr)> get bgp neighbor summary
BFD States: NC - Not configured, AC - Activating,DC - Disconnected
AD - Admin down, DW - Down, IN - Init,UP - Up
BGP summary information for VRF default for address-family: ipv4Unicast
Router ID: 192.168.240.3 Local AS: 100
Neighbor AS State Up/DownTime BFD InMsgs OutMsgs InPfx OutPfx
192.168.240.1 200 Estab 18:09:18 NC 3373 3423 12 14
Then we bring it down and test it with ping to see if it is really down:
edgenode-01a(tier0_sr)> ping 192.168.240.1
PING 192.168.240.1 (192.168.240.1): 56 data bytes
^C
edgenode-01a(tier0_sr)>
--- 192.168.240.1 ping statistics ---
8 packets transmitted, 0 packets received, 100.0% packet loss
And we verify again, and see the status is now ACTIVE:
edgenode-01a(tier0_sr)> get bgp neighbor summary
BFD States: NC - Not configured, AC - Activating,DC - Disconnected
AD - Admin down, DW - Down, IN - Init,UP - Up
BGP summary information for VRF default for address-family: ipv4Unicast
Router ID: 192.168.240.3 Local AS: 100
Neighbor AS State Up/DownTime BFD InMsgs OutMsgs InPfx OutPfx
192.168.240.1 200 Activ 00:00:26 NC 3373 3427 0 0
And we verify this is the logging server:

The SOURCE of this logging messages is the Edge VM itself where the log message is initiated from.
Enable logging on the Host Transport Nodes (ESXi Hosts)
In order to log Distributed Firewall Rules (DFW) you need to enable commands on the Host Transport nodes (ESXi hosts) itself. You don't need any logging configuration on the NSX-T Manager and we tested this by removing the commands on the manager:
nsxapp-01a> del logging-server 192.168.110.24 proto udp level info
nsxapp-01a> get logging-servers
nsxapp-01a>
And we have added the following configuration into the Host Transport nodes:
[root@esxcomp-02a:~] esxcli network firewall ruleset set -r syslog -e true
[root@esxcomp-02a:~] esxcli system syslog config set --loghost=udp://192.168.110.24:514
[root@esxcomp-02a:~] esxcli system syslog reload
[root@esxcomp-02a:~] esxcli system syslog mark -s "This is a test message"
[root@esxcomp-02a:~] esxcli system syslog config get
Default Network Retry Timeout: 180
Dropped Log File Rotation Size: 100
Dropped Log File Rotations: 10
Enforce SSLCertificates: false
Local Log Output: /scratch/log
Local Log Output Is Configured: false
Local Log Output Is Persistent: true
Local Logging Default Rotation Size: 1024
Local Logging Default Rotations: 8
Log To Unique Subdirectory: false
Message Queue Drop Mark: 90
Remote Host: udp://192.168.110.24:514
We have enabled the DFW firewall and configured a rule with a tag + logging enabled for testing purposes.


And we have done another ping test:
C:\Users\Administrator>ping 172.16.20.11
Pinging 172.16.20.11 with 32 bytes of data:
Reply from 172.16.20.11: bytes=32 time=46ms TTL=61
Reply from 172.16.20.11: bytes=32 time=6ms TTL=61
Reply from 172.16.20.11: bytes=32 time=6ms TTL=61
Reply from 172.16.20.11: bytes=32 time=6ms TTL=61
Ping statistics for 172.16.20.11:
Packets: Sent = 4, Received = 4, Lost = 0 (0% loss),
Approximate round trip times in milli-seconds:
Minimum = 6ms, Maximum = 46ms, Average = 16ms
C:\Users\Administrator>
And the logging messages appear nicely in our logging server

The SOURCE of this logging messages is the Transport Node itself where the log message is initiated from.
It is NOT possible to send the DFW to a separate logging server and split another type of messages and send these to another logging server. If you want this you have two options:
- Configure another (second) logging server on the ESXi host so all messages are sent to two different logging servers
- Use vRealize Log Insight to send all logging messages to and configure a forwarding with a filter to send out certain logging messages.
Below an example is given on how to configure multiple logging servers on the ESXi host:
[root@esxcomp-02a:~] esxcli system syslog config set --loghost=udp://192.168.110.24:514,udp://192.168.110.111:222
[root@esxcomp-02a:~] esxcli system syslog config get
Default Network Retry Timeout: 180
Dropped Log File Rotation Size: 100
Dropped Log File Rotations: 10
Enforce SSLCertificates: false
Local Log Output: /scratch/log
Local Log Output Is Configured: false
Local Log Output Is Persistent: true
Local Logging Default Rotation Size: 1024
Local Logging Default Rotations: 8
Log To Unique Subdirectory: false
Message Queue Drop Mark: 90
Remote Host: udp://192.168.110.24:514,udp://192.168.110.111:222
And if you want to go for option two then you configure the vRealize Log Insight Server with the below settings

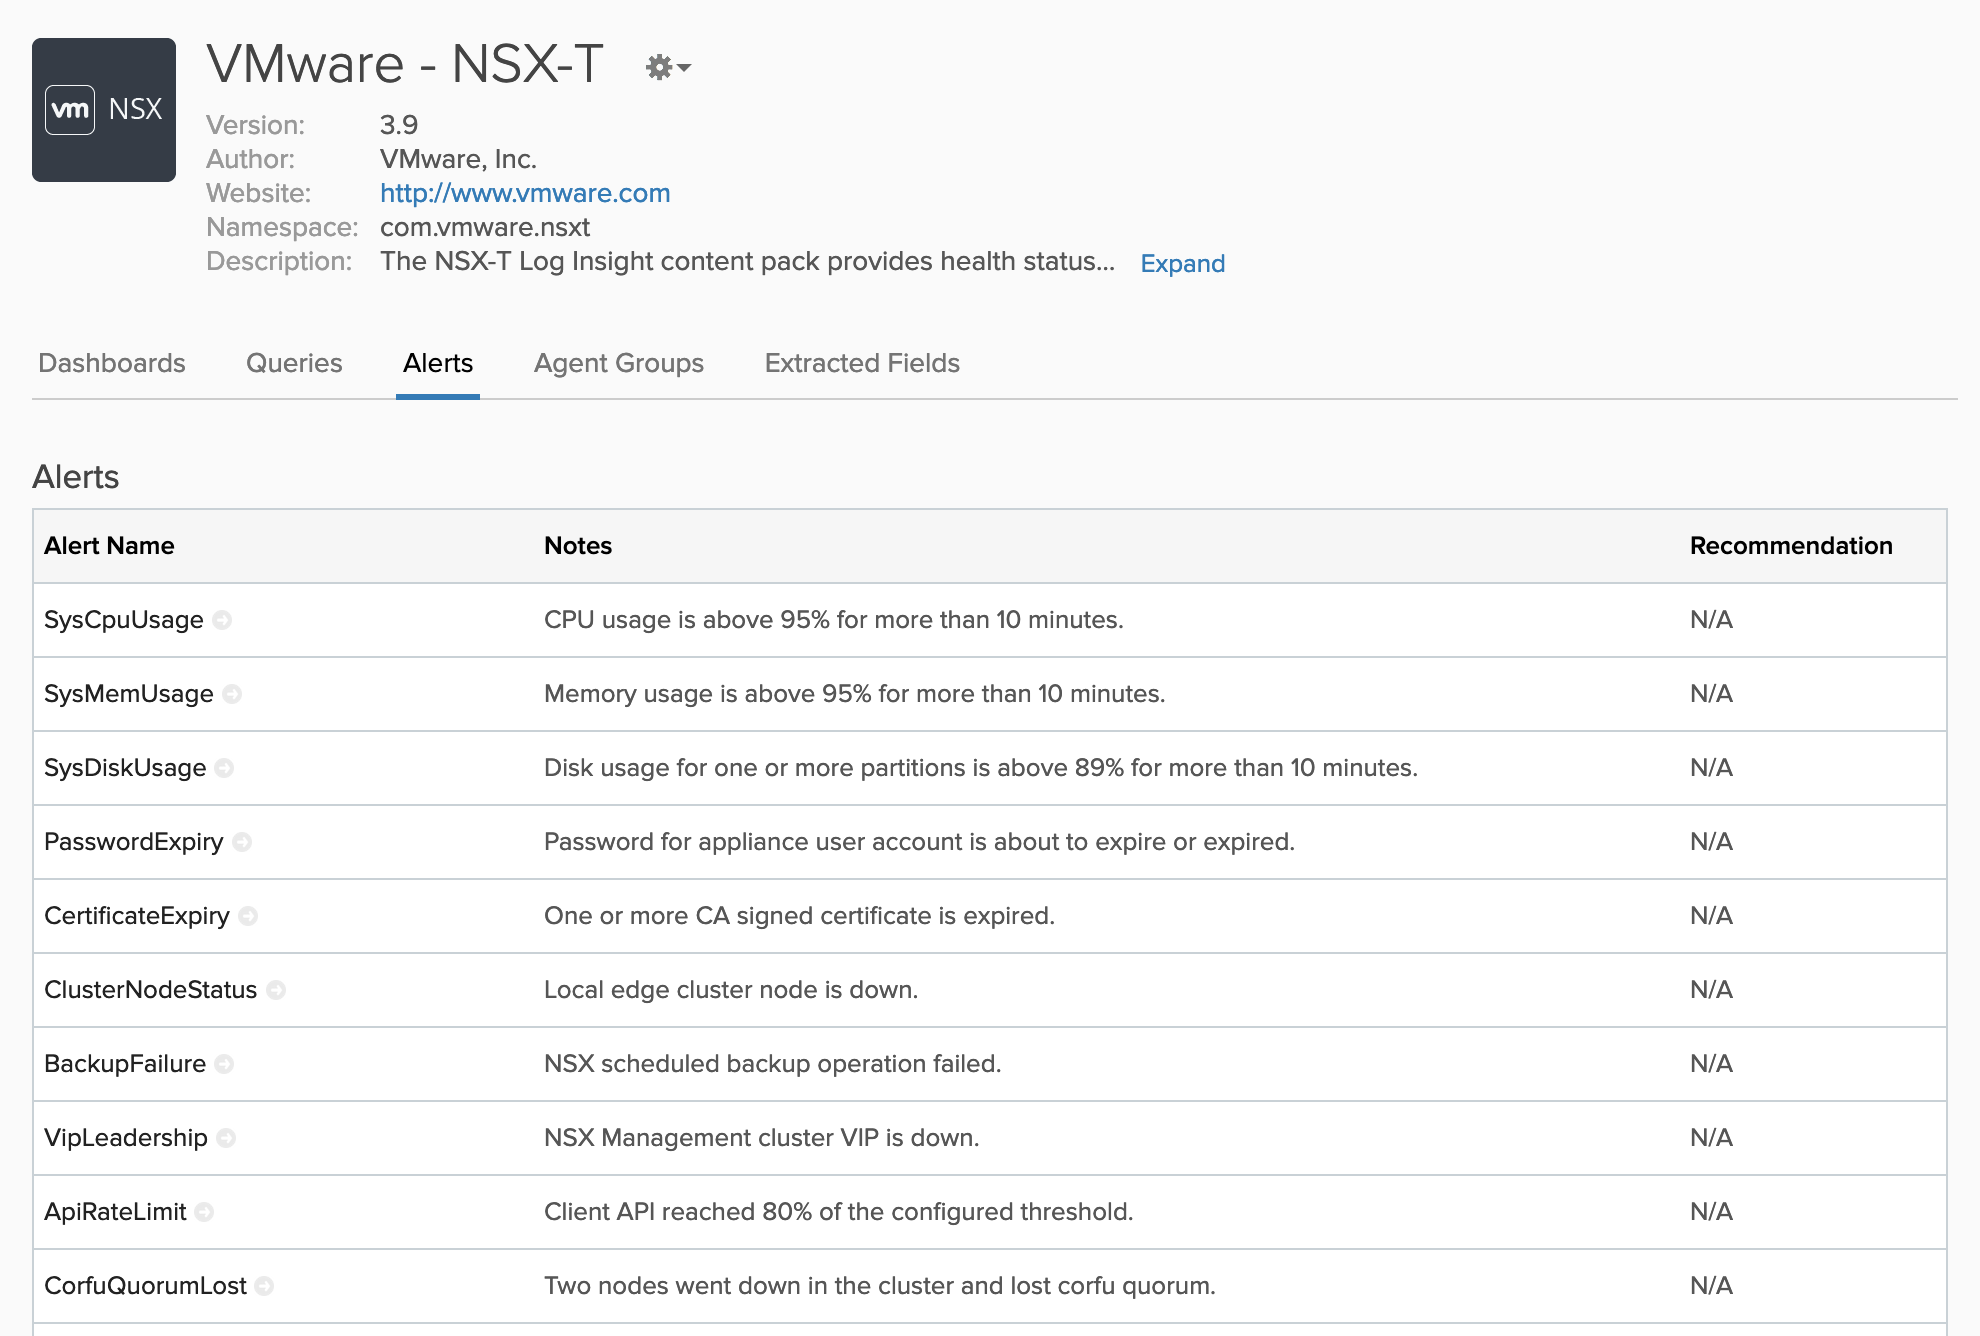
A complete list of pre-defined alerts can be find here:
SPLUNK SIEM CONFIGURATION
VMware also provides a VMware-supported Splunk app for NSX-T. It is available at https://my.vmware.com/ . Once on the NSX-T Data Center product page, navigate to the Drivers & Tools tab:
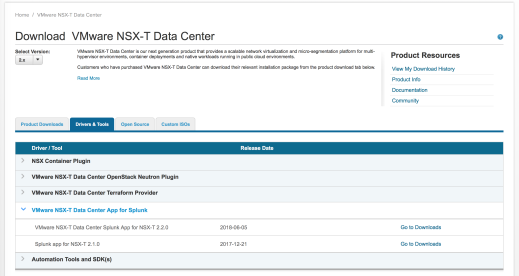
Figure 119: Downloading VMware supported Splunk app for NSX-T
It includes the same widgets and dashboards than the NSX-T Log Insight Content Pack. The screenshot below is only a sample.
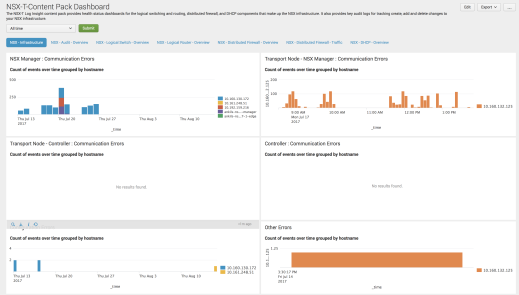
Figure 120: NSX-T Splunk app NSX-T Infrastructure dashboards
Sample of Splunk configuration
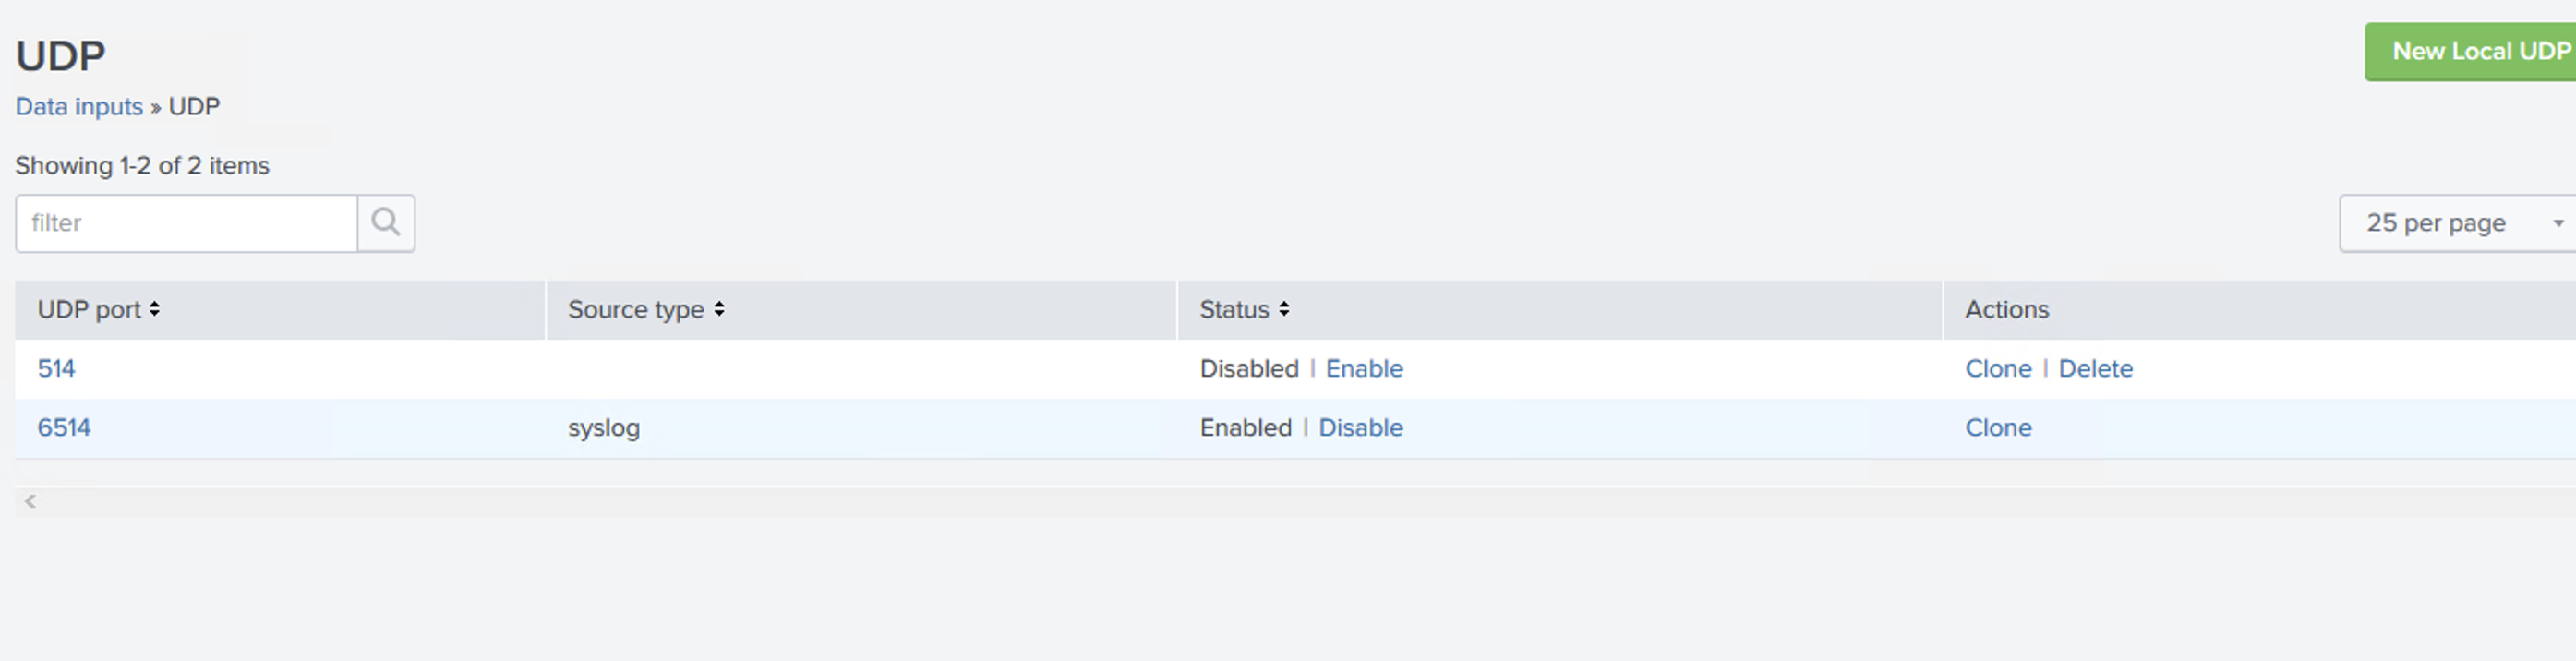
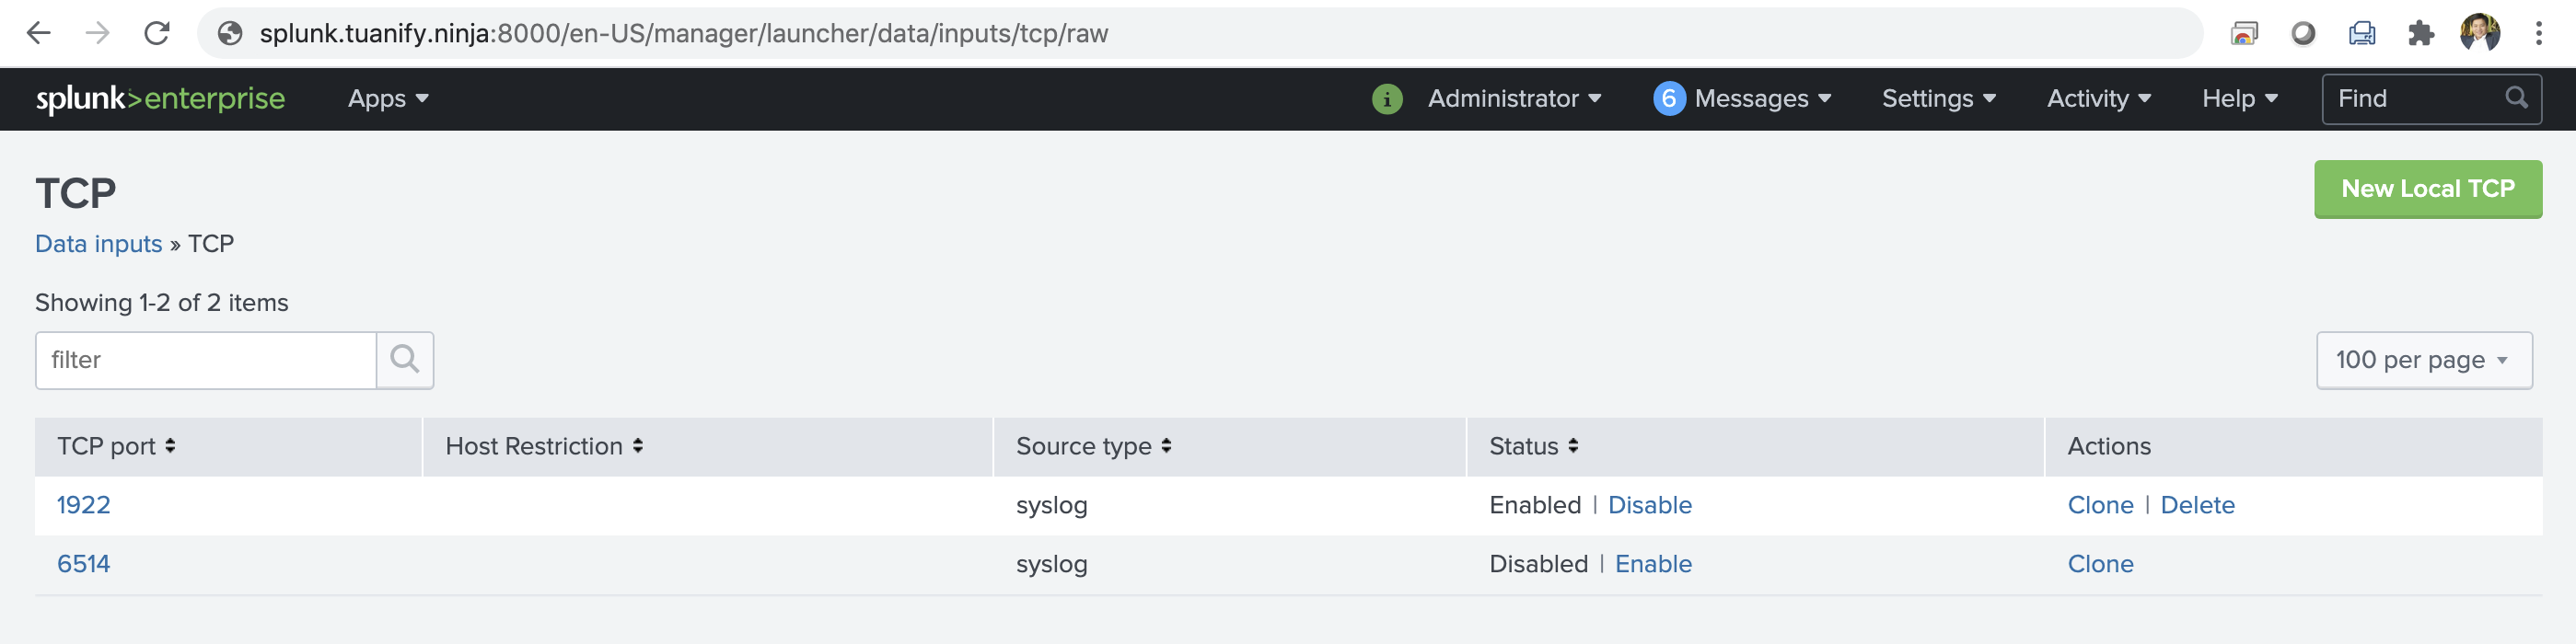
Here is sample of Splunk configuration – we support both non-TLS and TLS mode both UDP and TCP
[splunk@wdctestlab0022 ~]$ cd /opt/splunk/etc/apps/nsx_splunk_app/local/
[udp://6514]
sourcetype = syslog
no_appending_timestamp = true
no_priority_stripping = true
connection_host = ip
[tcp://6514]
sourcetype = syslog
connection_host = ip
[tcp-ssl://6514]
sourcetype = syslog
[SSL]
requireClientCert = false
serverCert = $SPLUNK_HOME/etc/auth/server.pem
sslPassword = password
ui/default.xml
<nav search_view="search" color="#65A637">
<view name="search" default='true' />
<a href="nsxt_logging_splunk_app_dashboard">NSX-T Dashboard</a>
</nav>

CLI in Splunk
NSX CLI for configuring external syslog collector:
set logging-server <hostname-or-ip-address[:port]> proto <proto> level <level> [facility <facility>] [messageid <messageid>] [serverca <filename>] [clientca <filename>] \
[certificate <filename>] [key <filename>] [structured-data <structured-data>]
The facility, messageid, and structured-data fields are optional and for filtering logs. All NSX logs uses facility local6, and supported message id and structured data keys are defined in LogMessageId.java and NsxStructuredData.java
Support protocols include: UDP, TCP, TLS, LI, and LI-TLS. If LI or LI-TLS is configured, then Log Insight agent will be used to forward logs. Otherwise, rsyslogd will be used for log forwarding:
nsxmanager-ob-13668378-1-firestar> set logging-server 1.1.1.1 proto
tcp TCP logging server protocol
udp UDP logging server protocol
tls TLS logging server protocol
li LI logging server protocol
li-tls LI-TLS logging server protocol
The default port numbers are: tcp/udp (514), tls (6514), li (9000), li-tls (9543).
TLS (optional)
set logging-server 10.143.1.219 proto tls level info serverca RootCA.crt clientca RootCA.crt certificate client.crt key client.key
To use TLS and/or LI-TLS protocol, certificate file(s) are required. For TLS, two CA certificates along with a pair of certificate and private key for the NSX appliance need to be specified. For LI-TLS, a CA certificate need to be specified.
Creating certificates with XCA
To download XCA tool: https://hohnstaedt.de/xca/index.php/download
Detailed manual is available at https://hohnstaedt.de/xca/index.php/documentation/manual
- In XCA create a new database at Files → New DataBase. If a database is already created, open it at Files → Open DataBase.
- In the Private Keys tab, create a Private key by clicking "New Key" and fill the required information.
- In the Certificates tab, create a CA certificate by clicking "New Certificate" and fill the required information. Note that CRL Distribution Point (CDP) is mandatory because CRL checking is enabled by default on the NSX manager. If CDP is not available, refer to the next section "Disabling CRL checking" for details.
- Once the CA certificate is created, select the created CA certificate and click "New Certificate" to create a leaf certificate that is signed by the CA certificate:
- Once completed, you should see something like below.
- The created certificates and keys can then be exported for future uses.
Using XCA, you need to create at least one CA certificate and two leaf certificates for the NSX appliance and remote syslog server, respectively. The created certificate and key files can be placed under /image/vmware/nsx/file-store for easy access from the NSX CLI. For example:
nsxmanager-ob-13668378-1-firestar> get files
Directory of filestore:/
-rw- 2143 May 20 2019 21:21:43 UTC rootca.crt
-rw- 25269 May 12 2019 22:33:48 UTC aggsvc_poll_intervals_change_helper.py
-rw- 5375 May 12 2019 22:33:48 UTC nsx_backup_cleaner.py
-rw- 40084 May 12 2019 22:33:48 UTC backup_restore_helper.py
-rw- 1996 May 15 2019 00:24:41 UTC cert.pem
-rw- 1851 May 15 2019 00:25:02 UTC key.pem
-rw- 2143 May 15 2019 00:24:29 UTC ca.pem
-rw- 5103 May 12 2019 22:33:48 UTC get_backup_timestamps.sh
-rw- 1842 May 17 2019 17:30:22 UTC test.pem
Disabling CRL checking
The crl_checking_enabled flag is a part of SecurityGlobalConfig which is a part of api/v1/global-configsTo get the current SecurityGlobalConfig when logged into a manager:
root@manager1:~# curl -k -X GET -H 'accept: application/json' https://127.0.0.1/api/v1/global-configs/SecurityGlobalConfig -u 'admin:VMwarensbu_1'
{
"crl_checking_enabled" : true,
"ca_signed_only" : false,
"resource_type" : "SecurityGlobalConfig",
"id" : "c80387b9-3c80-46ae-970d-6590d06acba8",
"display_name" : "c80387b9-3c80-46ae-970d-6590d06acba8",
"_create_user" : "system",
"_system_owned" : false,
"_create_time" : 1574364819458,
"_last_modified_user" : "system",
"_last_modified_time" : 1574364819493,
"_protection" : "NOT_PROTECTED",
"_revision" : 2
}
To update it when logged into a manager:
root@manager1:~#curl -i -k -H Content-type:application/json -u 'admin:VMwarensbu_1' -T CRL_FALSE https://127.0.0.1/api/v1/global-configs/SecurityGlobalConfig
where CRL_FALSE file will contain:
{
"crl_checking_enabled" : false,
"resource_type": "SecurityGlobalConfig",
"_revision" : 2
}
Server Configuration
To configure the server certificate on Log Insight, go to Administration → SSL and upload a new certificate file. For example:
To configure the server certificate on Splunk, edit /opt/splunk/etc/apps/nsx_splunk_app/default/inputs.conf and make serverCert point to the path of the certificate file. For example:
root@dev:~# cat /opt/splunk/etc/apps/nsx_splunk_app/default/inputs.conf
# Insecure methods such as UDP/TCP are prohibited on Splunk Cloud™
[tcp-ssl://6514]
sourcetype = syslog
[SSL]
requireClientCert = false
serverCert = $SPLUNK_HOME/etc/auth/test/server.pem
sslPassword = password
Note that Splunk needs to be restarted for the changes to take effect. This can be done by running "/opt/splunk/bin/splunk restart".
Client Configuration
Place the created certificate and key files in /image/vmware/nsx/file-store for easy access from the CLI. Then run the set logging-server command in CLI.
Log Insight server example:
set logging-server 10.2.226.186 proto li-tls level info serverca rootca.crt
Splunk server example:
set logging-server 10.33.82.143 proto tls level info serverca ca.pem clientca ca.pem certificate cert.pem key key.pem
The configured logging servers can be viewed by running the "get logging-servers" command.
Dashboard/Alert Customization
To create or modify dashboard widgets and/or alerts in the content pack, feature teams can modify support/tools/integration/splunk/cpgenerator/config.yaml.
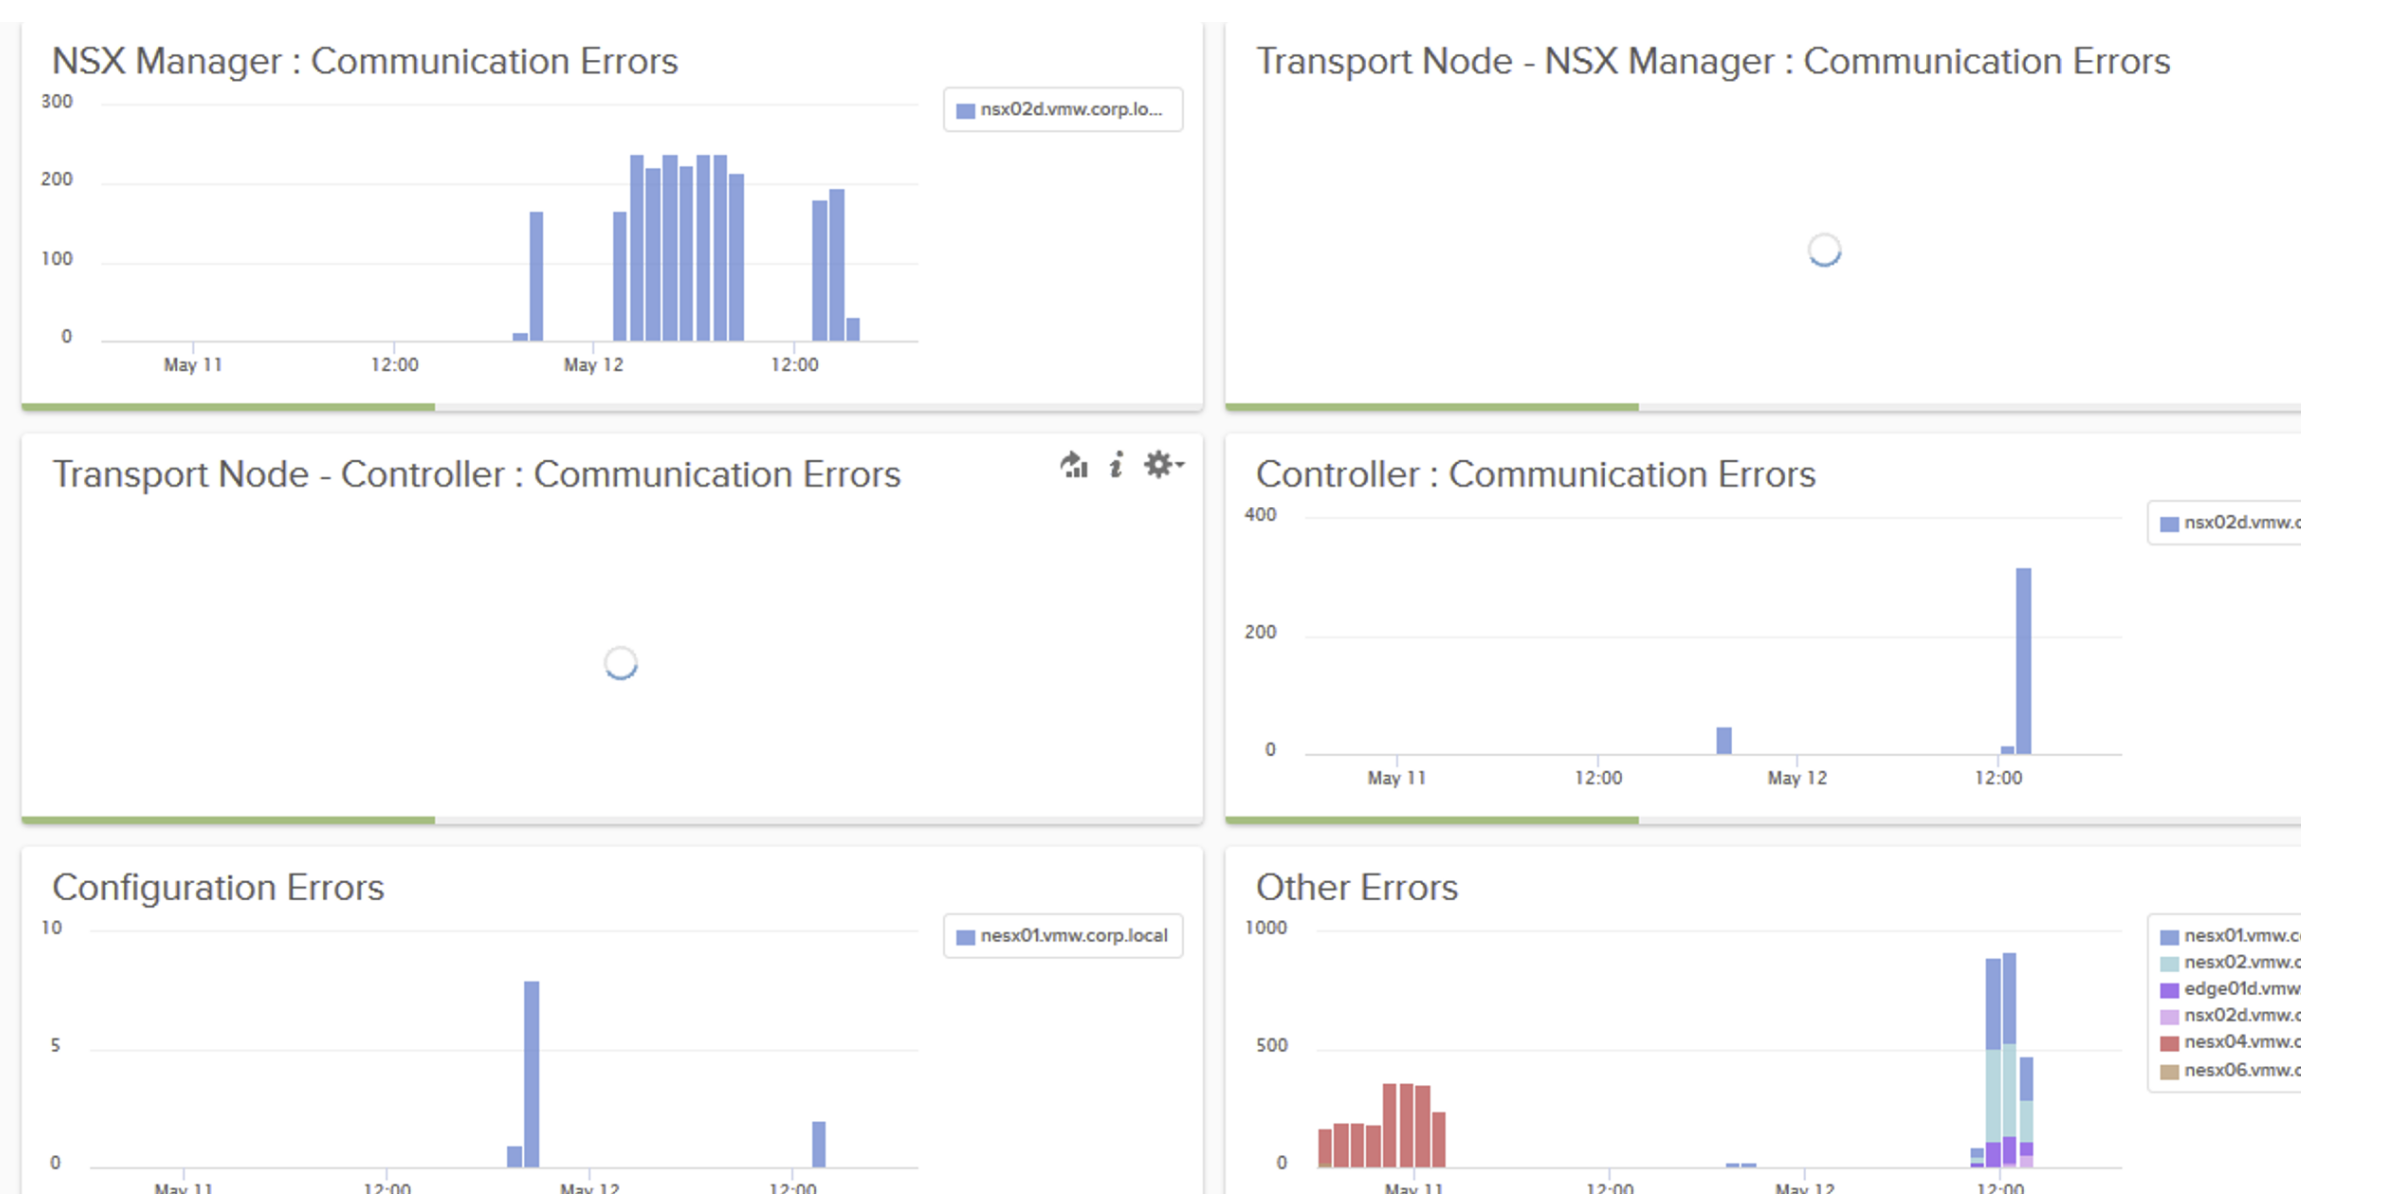
A dashboard is called a "tab" and a widget within that dashboard is called a "chart". Within each tab definition, there is a list of charts. Within each chart defnition, the feature teams need to specify the name, description, type, width, and query of the chart. Below is an example:
tabs:
- tab_1:
tab_name: "NSX - Infrastructure"
charts:
- chart_1:
chart_name: "NSX Manager : Communication Errors"
chart_desc_splunk: "Count of events over time grouped by hostname"
chart_desc_li: "These are all communication log errors on nsx-manager.<br><br>They are grouped by hostname."
chart_type: "stacked_column"
chart_width_splunk: "50"
chart_width_li: "1/2"
chart_query_splunk: "<Splunk query>"
chart_query_li: "<Log Insight query>"
- chart_2:
...
- tab_2:
...
Here we created a dashboard called "NSX - Infrastructure". Within this dashboard we created a widget called "NSX Manager : Communication Errors". The chart_type field is for LI content pack and currently we support three types: stacked_column, table, and count. The value 50 for char_width_splunk means this widget will take 50% of the Splunk web page width. Similarly the value 1/2 for chart_width_li means the widget will take half of the LI web page width. The hard part is to figure out the Splunk and LI queries. Typically, you will need to have access to a Splunk server and an LI server. For Splunk, simply make sure the query runs correctly (i.e. returns the desired result). For LI, you need to create a custom widget under "My Dashboards" and then export the widget to obtain the query. An easy way is to clone an existing widget and then modify it.
Take "Logical Switch Created" for example, the filters we need are:
- Text "comp" exists in the log
- appname = NSX
- msgid = SWITCHING
- vmw_nsxt_comp = nsx-manager
- vmw_nsxt_operation = CreateLogicalSwitch
- vmw_nsxt_audit_operation_status = success
And we need to display the count of matching results. For Splunk, the query would be:
comp msgid="SWITCHING" comp="nsx-manager" | regex vmw_nsxt_operation = "CreateLogicalSwitch" | where vmw_nsxt_audit_operation_status="success" | stats count | appendpipe [stats count | eval NoResult="" | where count=0 | fields - count]
*At current 3.0.x, to make it working, you need to switch to MP mode before creating any event so it will show up in our NSX dashboard on Splunk.
No matter which mode chosen MP or Policy, you will not lose any data in Splunk, all will show up in Splunk but the current NSX plugin for Splunk only works on MP structure. The next version of plugin will support Policy.
If you wanna inist to use Policy mode, you can create a custom plugin which is fairly easy to do so with the right structure but it will not show in our NSX plugin tab in Splunk- gonna be only on the custom tab.
https://nsx.techzone.vmware.com/resource/nsx-t-vds-7-guide
NSXT --> VRLI --> Proxy syslog --> PAN --> Cisco FW--> Splunk
Install a Custom SSL Certificate
By default, Splunk and vRealize Log Insight installs a self-signed SSL certificate on the virtual appliance.
The self-signed certificate generates security warnings when you connect to Splunk or Log Insight web user interface. If you do not want to use a self-signed security certificate, you can install a custom SSL certificate. The only feature requiring a custom SSL certificate is Event Forwarding through SSL.
Prerequisite
- Verify that your custom SSL certificate meets the following requirements.
- The CommonName contains a wildcard or exact match for the Master node or FQDN of the virtual IP address. Optionally, all other IP addresses and FQDNs are listed as subjectAltName.
- The certificate file contains both a valid private key and a valid certificate chain.
- The private key is generated by the RSA or the DSA algorithm.
- The private key is not encrypted by a pass phrase.
- If the certificate is signed by a chain of other certificates, all other certificates are included in the certificate file that you plan to import.
- The private key and all the certificates that are included in the certificate file are PEM-encoded. vRealize Log Insight does not support DER-encoded certificates and private keys.
- The private key and all the certificates that are included in the certificate file are in the PEM format. vRealize Log Insight does not support certificates in the PFX, PKCS12, PKCS7, or other formats.
- Verify that you concatenate the entire body of each certificate into a single text file in the following order.
- The Private Key - your_domain_name.key
- The Primary Certificate - your_domain_name.crt
- The Intermediate Certificate - DigiCertCA.crt
- The Root Certificate - TrustedRoot.crt
- Verify that you include the beginning and ending tags of each certificate in the following format.
- -----BEGIN PRIVATE KEY-----
- (Your Private Key: your_domain_name.key)
- -----END PRIVATE KEY-----
- -----BEGIN CERTIFICATE-----
- (Your Primary SSL certificate: your_domain_name.crt)
- -----END CERTIFICATE-----
- -----BEGIN CERTIFICATE-----
- (Your Intermediate certificate: DigiCertCA.crt)
- -----END CERTIFICATE-----
- -----BEGIN CERTIFICATE-----
- (Your Root certificate: TrustedRoot.crt)
-----END CERTIFICATE-----
- Verify that you are logged in to Splunk or vRealize Log Insight web user interface as a user with the Edit Admin permission.
Connection Tools
Port Connection Tool and Traceflow are two great tools for troubleshooting communication between workloads running in NSX. They show real-time information of the topology and detected issues (if any), thus reducing the time it takes to find out what is preventing such communication.
Network Topology Tool
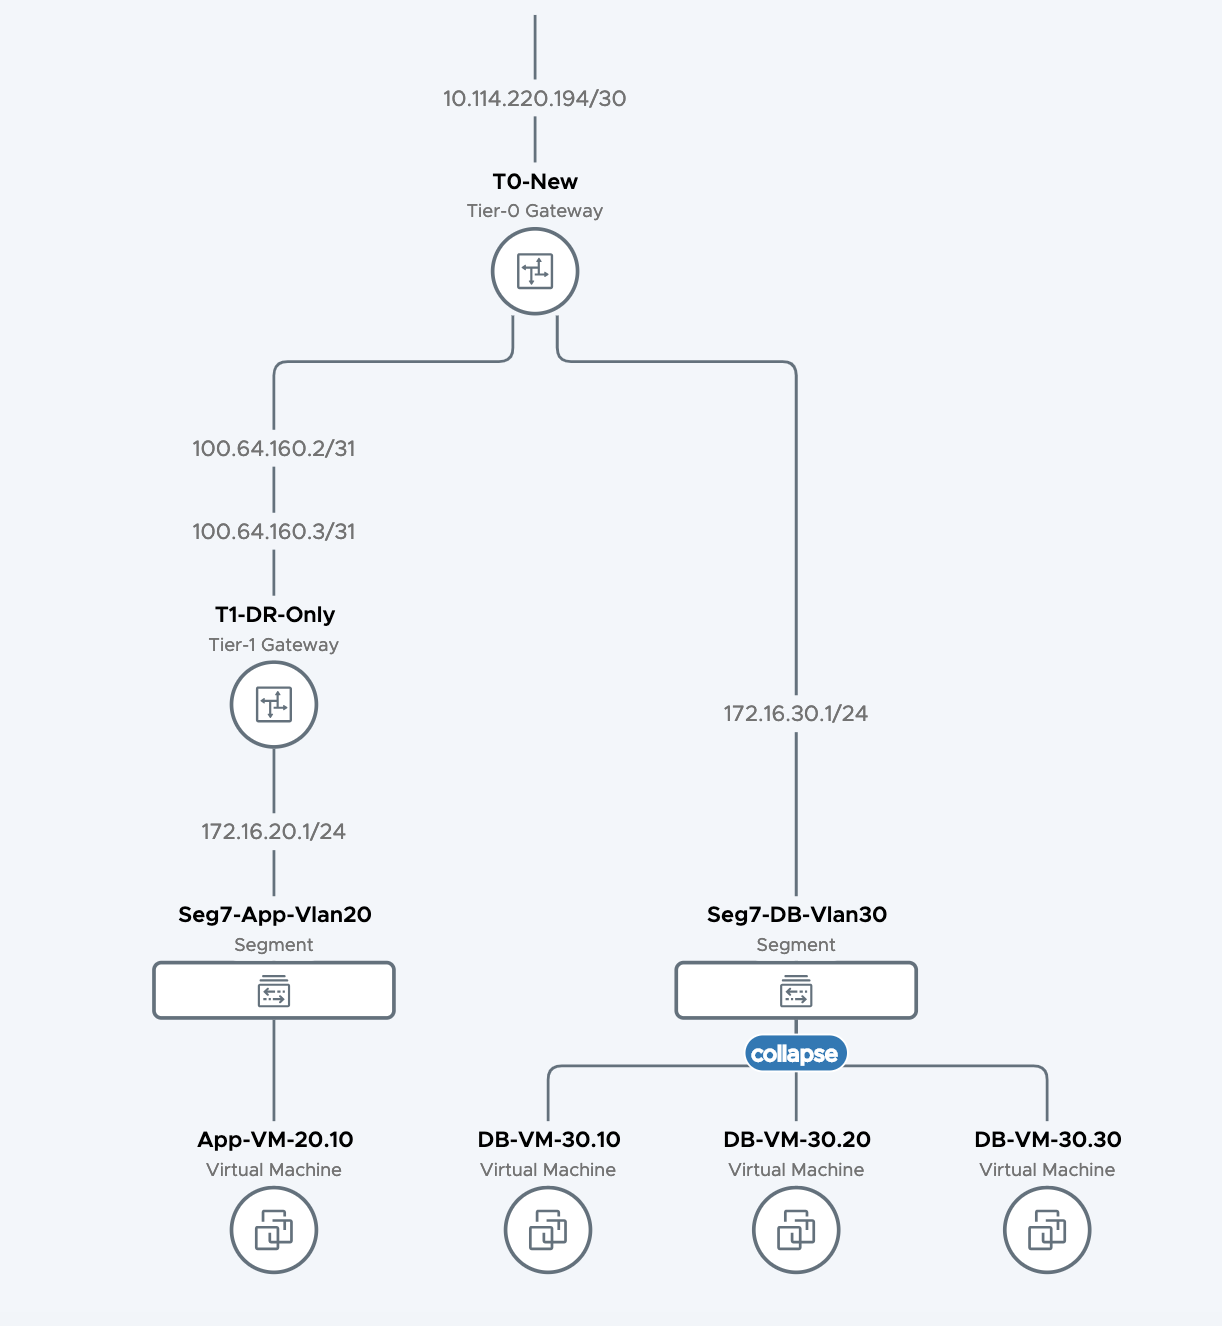
Network Topology provides you an overview of your NSX environment. It can be exported as PDF as well.
Port Connection Tool
Port Connection Tool provides visual information of the logical and physical connectivity between the interfaces of two workloads running in NSX, including VMs and containers.
It shows a visual map with layers that display realized state data such workload information, Logical Port status and Tunnel-health status, representing hop by hop connectivity between various points in the path.
It is possible to click on any of the components in the visual output to reveal more information about them. If issues are found, the corresponding components are displayed in yellow or red.
![]()
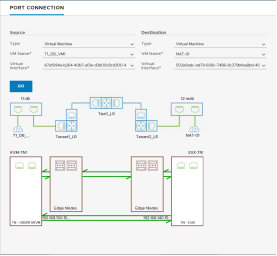
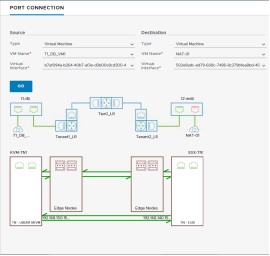
Figure 121: Port Connection Tool visualizations, without and with port issues (resp.)
Traceflow
Traceflow takes troubleshooting a step further by injecting a packet at the logical port of the source workload, and displaying the step-by-step path such a packet takes until it reaches the destination workload. Admins can specify multiple characteristics of the packet to be injected, so that it matches their troubleshooting needs.
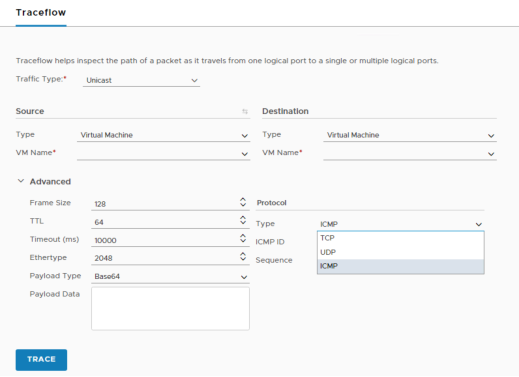
Figure 122: Traceflow, specifying packet details
The trace packet traverses the logical switch overlay, but is not visible to interfaces attached to the logical switch, meaning, no packet is actually delivered to the intended recipients. Traceflow output includes a table listing Observation Type (Delivered, Dropped, Received, Forwarded), Transport Node, and Component, and the Port Connection Tool graphical map of the topology if unicast and logical switch as a destination are selected.
Clicking on the components in the visual output reveals more information about them.
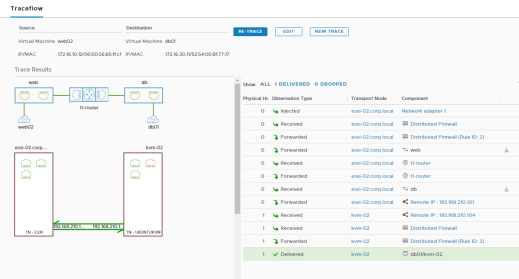
Figure 123: Traceflow output, delivered packet
When there are connectivity issues, the table of observations and the visual output may provide different information. In the example below, the diagram shows the physical and logical port connectivity between the source and destination workloads while Traceflow observations report that the packet being injected is being dropped by the distributed firewall rule ID 1031.
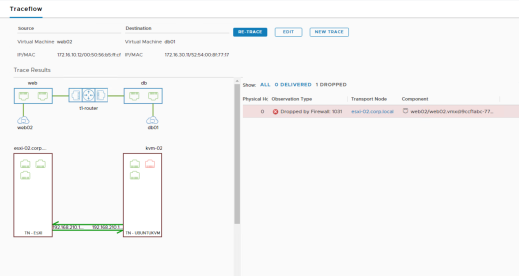
Figure 124: Traceflow output, distributed firewall dropping the packet
6.1 IPFIX
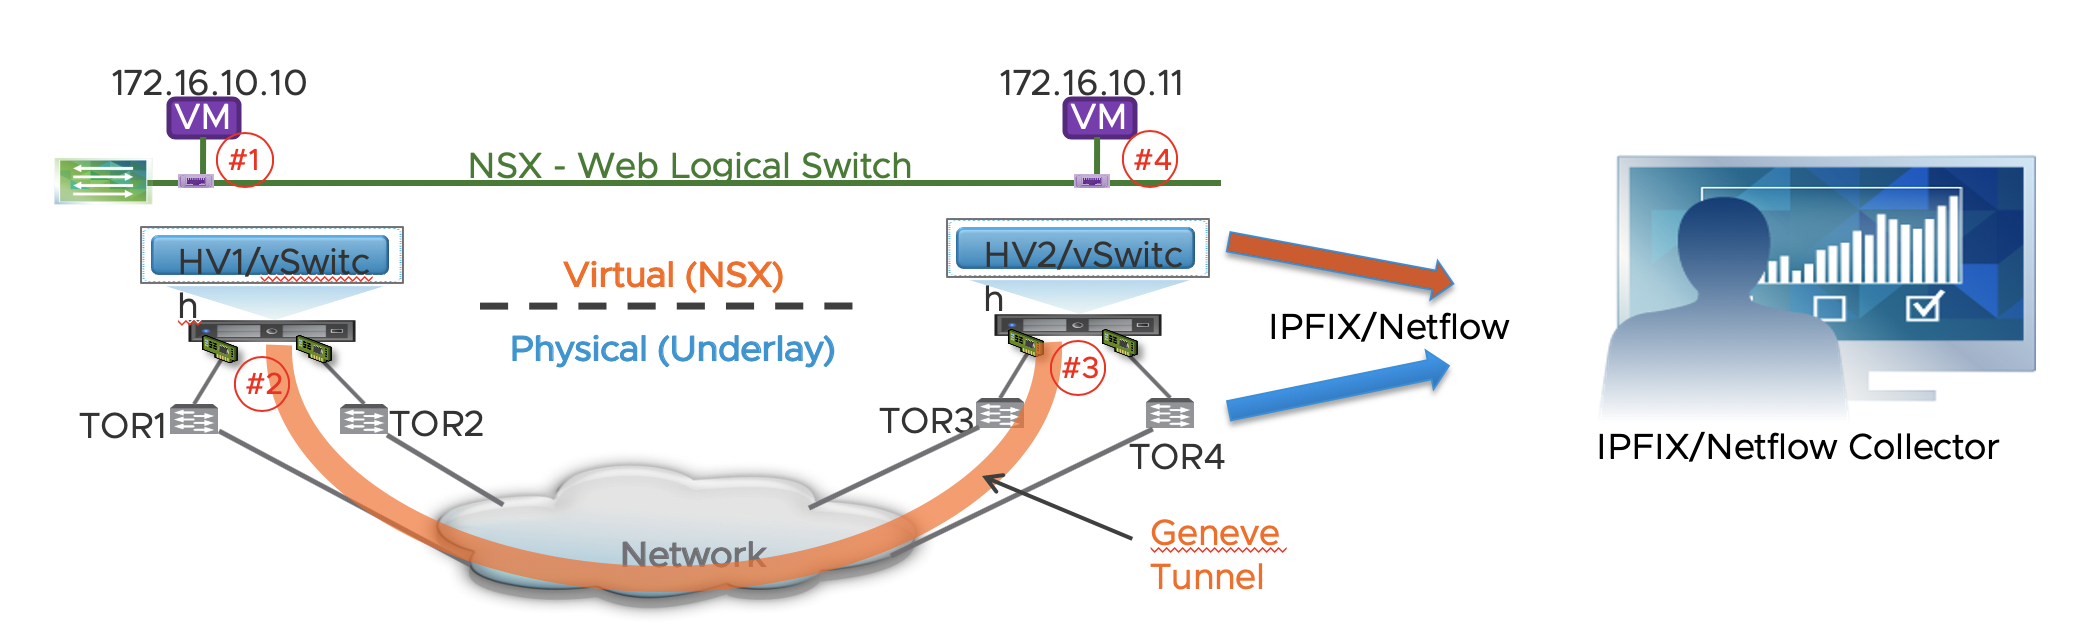
IPFIX stands for IP Flow Information eXport, where in turn, IP stands for Internet Protocol. It is a standard protocol for the format and export of network flow information, which is collected by a remote IPFIX collector, that will typically display the information in an easy-to-understand way.
When IPFIX is enabled in NSX, all configured host transport nodes will send IPFIX messages to the collectors using port 4739. For ESXi hosts, NSX automatically opens port 4739. For KVM hosts, NSX does not automatically open the port, so if the host firewall is enabled, admins must manually open port 4739.
NSX supports IPFIX for switches and firewalls:
- For switches, network flow at VIFs (virtual interfaces) and pNICs (physical NICs) is exported
- For firewalls, network flow that is managed by the distributed firewall component is exported.
Also, NSX permits the use different IPFIX collectors and configuration profiles for both switches and firewalls:
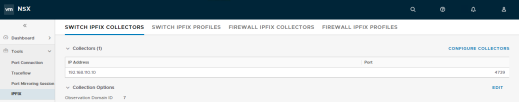
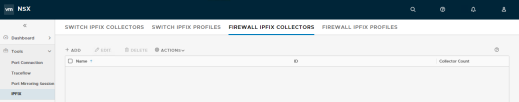
Figure 125: IPFIX configuration menus
Please check the NSX Administration Guide for further details on IPFIX configuration.
Port Mirroring
NSX supports several types of port mirroring, so that admins have flexibility to choose the one that fits better their troubleshooting/monitoring needs:
- Local SPAN – To be used when both NICs, source and destination of the mirroring session, are on the same Transport Node. It does support PNICs or VNICs as the source and only VNICs as the destination of the capture.
- Remote SPAN – It offers two variants:
- RSPAN Source Session - Mirror network traffic from virtual machine interfaces to specific physical NICs over RSPAN VLAN IDs
- RSPAN Destination Session - Mirror network traffic from RSPAN VLAN IDs to specific virtual machine interfaces.
Both require the use of an Encapsulation VLAN ID, and the original VLAN of the traffic being captured and be preserved.
- Remote L3 SPAN – Forwards captured traffic to a remote IP address (destination server), encapsulated in one of the three following protocols:
- GRE
- ERSPAN type two
- ERSPAN type three
Configuration options vary depending on the selected encapsulation mode.
- Logical SPAN – Source and destination of the traffic being capture must reside on the same NSX Logical Switch. This mode of SPAN continues to work even in the event of VM VMotions.
Note: Configuration options and restrictions may vary depending on the selected mirroring mode. Please check NSX-T Administration Guide for details
All Port Mirroring configuration options are available under Tools > Port Mirroring Session:
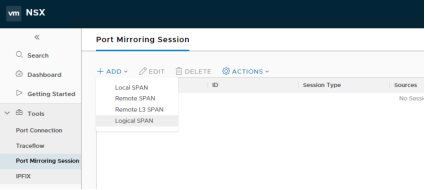
Figure 126: Configuring Port Mirroring Sessions
From the very same menu it is possible to review the details and/or delete the session once the relevant traffic has been captured:
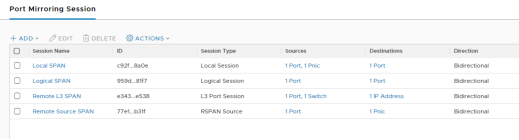
Figure 127: Reviewing Port Mirroring Sessions
Packet Captures
If troubleshooting or monitoring require so, it is possible to do data plane packet captures on NSX Transport Nodes (Edges, KVM hosts, ESXi hosts).
On KVM and Edge node, there is a common command, start capture, that can be leveraged on those Transport Nodes, though options may vary depending on the type of node.
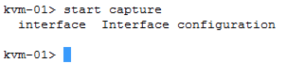
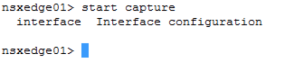

Figure 128: Packet Capture command outputs from different nodes
Packet capture commands allow to specify expressions or parameters so that only significative traffic is captured.
On ESXi host, pktcap-uw is a powerful packet capture tool which capture packet ats different inside ESXi host and show packet going through different processes on the data path.
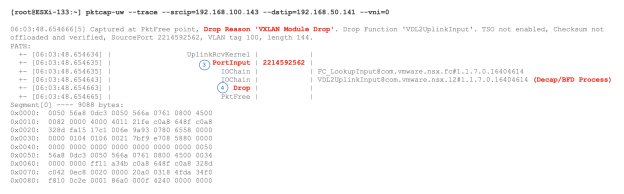
We will show some pktcap-uw example in the following case study as well.
Details of pktcap-uw can be found here, https://docs.vmware.com/en/VMware-vSphere/7.0/com.vmware.vsphere.networking.doc/GUID-5CE50870-81A9-457E-BE56-C3FCEEF3D0D5.html